Figures & data
Figure 1. Microbial diversity of gut microbiota in professional Chinese female rowing athletes reveals that significant differences exist in elite and youth non-elite athletes. Comparison of (a) Shannon index and (b) Simpson index of microbial communities among AE, YE and YN cohorts. Linear discriminant analysis was performed to maximize the separation of AE, YE and YN cohorts based on (c) taxonomical composition and d: functional composition collapsed to the level three of the KEGG hierarchy
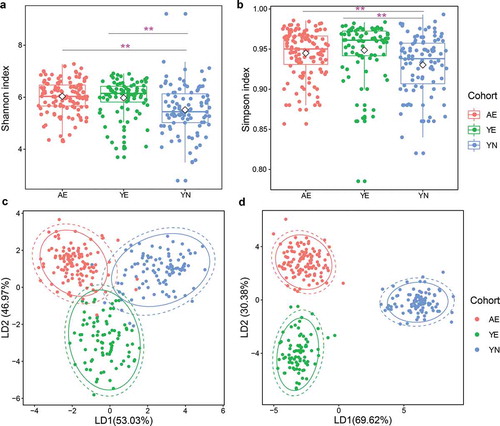
Figure 2. Differentially abundant taxonomical, phenotypic and functional compositions in gut microbiomes for elite and youth non-elite athletes. (a) Ternary plot showing the distribution of samples from AE, YE and YN cohorts based on the relative abundance of three dominant phyla. (b) Radar charts showing the taxonomical composition for AE, YE and YN cohorts at the genus level. The genera with mean relative abundances greater than 1.5% of the total abundance in these three cohorts are included. Thus, only the 14 most abundant genera in each group are shown for clarity. (c) Phenotypic composition for AE, YE and YN cohorts. Discrete phenotype relative abundances were compared using pairwise Mann–Whitney–Wilcoxon tests with false discovery rate correction. (d) Functional composition for AE, YE and YN cohorts. The KOs with mean relative abundances greater than 0.2% of the total abundance in these three cohorts are included. Ultimately, only the 13 most abundant KOs in each group are shown for clarity
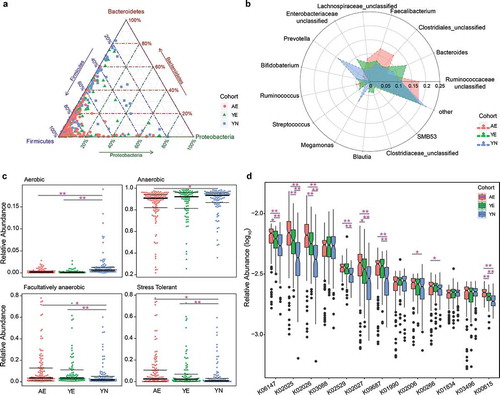
Figure 3. Gut enterotypes in elite and youth non-elite athletes. A total of 306 samples are stratified into three enterotypes. The major contributor in the three enterotypes is Prevotella, Bacteroides and Ruminococcaceae_unclassified, respectively. (a) Relative abundances of the top genera (Prevotella, Bacteroides and Ruminococcaceae_unclassified) in each enterotype. (b) Three enterotypes were visualized by PCoA of Jensen-Shannon distance at the genus level. (c) The proportion of AE, YE and YN samples distributed in three enterotypes. 72.3% AE, 61.9% YE and 27.27% YN samples are found in enterotype 3. (d) Co-occurrence patterns among the dominant genera (average relative abundance > 0.01%) across the samples from enterotype 3, as determined by the Spearman correlation analysis
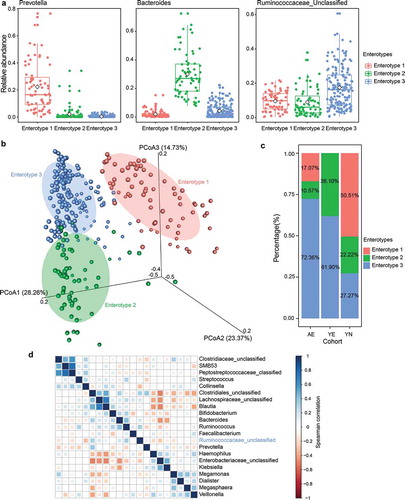
Figure 4. Correlations between enriched microbiota and dominant functional traits. (a) Correlation among the 50 differentially abundant microbiota in professional Chinese female rowing athletes. Nodes with correlations between circles are labeled with faint red (positive correlation) and green (negative correlation). The area of each circle is divided into three parts labeled with faint red (enriched in AE cohort), green (enriched in YE cohort) and pale blue (enriched in YN cohort). The colors of the boundary of circles represent different phylum. (b) Correlations between abundant microbiota and abundant functional composition, as determined by the Spearman’s rank correlations analysis
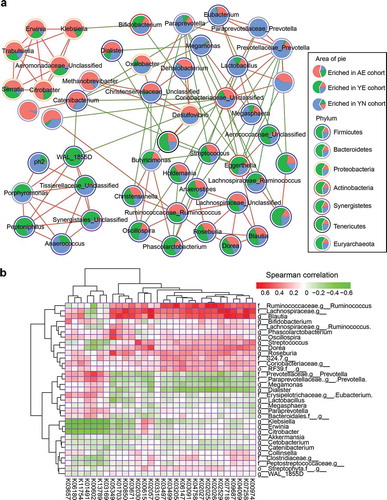
Figure 5. Biomarker analysis and a classification assessment for the monitoring of potential of athletes. (a) Taxonomical biomarkers for identification of AE, YE and YN cohorts. (b) Functional biomarkers for identification of AE, YE and YN cohorts. Random forest models are constructed using the (c) taxonomical biomarkers, (d) functional biomarkers, and (e) the combination of taxonomical biomarkers and functional biomarkers for differentiating the AE cohort (faint red) and YE cohort (green) from YN cohort
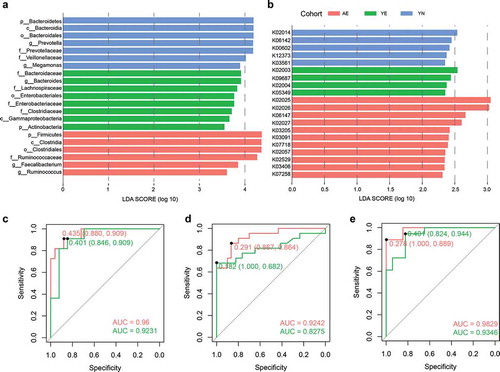
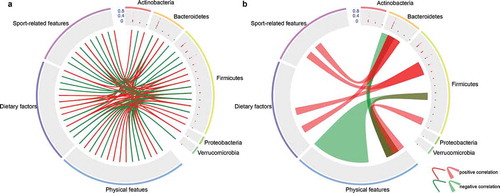
Figure 6. Correlations between environmental factors and dominant microbiota. (a) Correlation between the 22 differentially abundant microbiota (genus level) and environmental factors. (b) Correlations between one microbiota and multiple factors or between multiple microbiota with one factor. Among the 78 differentially abundant microbiota (0.05%), 22 differentially dominant microbiota were selected based on the p value (p < .05) and Spearman correlation coefficients (cutoff > 0.6). Genera are grouped at the phylum level. The 37 factors were divided into three groups, including physical features (15), dietary features (12) and sport-related features (10). Lines and ribbons were colored according to the Spearman correlation coefficients. Red links represent positive correlation while green links represent negative correlation