
Figures & data
Figure 1. Sigirr-/- mice show increased susceptibility to p19A colonization of the GI tract
(a) The numbers of p19A bacteria in feces from PBS- (n = 3–6) or vancomycin- (n = 4–6) pretreated (6 h before infection) WT (C57BL/6) mice were determined over a 60-day infection period. nd, not detected. Data are representative of two independent experiments. (b) The numbers of p19A in the ceca, colons and colonic lumen of vancomycin-pretreated plus p19A-infected WT (n = 9) and Sigirr -/- mice (n = 12) were determined at day 5 post-infection. Data are representative of two independent experiments. (c) Bioluminescence signals from the large intestines (before and after washing with PBS) of vancomycin-pretreated, p19A-lux-infected WT and Sigirr -/- mice were imaged by an in vivo imaging system at day 5 post-infection. The color bar shown on the right indicates the strongest bioluminescence signal in red and the weakest bioluminescence signal in blue. The bioluminescence signal corresponds to logarithmic units of light measurement (photons/s/cm2/sr). Data are representative of two independent experiments. (d) Vancomycin-pretreated WT and Sigirr -/- mice were infected with p19A-GFP (expressing GFP on p19A chromosome) for 5 days, and the colonization of p19A-GFP on the cecal mucosal surface was visualized by immunostaining with antibodies against actin (red) and GFP (green). The nuclei were counterstained with DAPI (blue). Scale bar 20μm (D), and scale bar 100μm for (E) Data are representative of three independent experiments. (e) Representative H&E staining pictures of ceca of WT and Sigirr -/- mice (pretreated with vancomycin) at day 0 (n = 6 for both groups of mice) and day 5 (n = 9 for WT, n = 15 for Sigirr -/-) post p19A infection. Scale bar 20μm (D), and scale bar 100μm for (E) (f) Histopathological scores from cecal tissues of WT and Sigirr -/- mice used in (E). Data are representative of three independent experiments. *p < .05, **p < .01, ***p < .001.
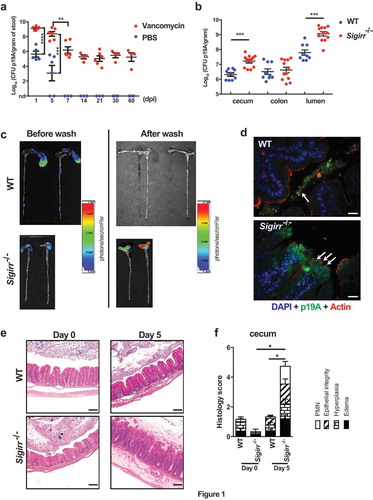
Figure 2. Acute infection with p19A worsens subsequent DSS-induced colitis in Sigirr -/- mice
(a – b) Vancomycin-pretreated Sigirr -/- mice were gavaged with p19A (n = 8) or E. coli DH10B (n = 14) for 1 day, then exposed to 2.5% DSS in drinking water for another 4 days, and their body weight (a) and disease activity index (DAI) (b) was recorded daily. Data are representative of six independent experiments. (c) Representative macroscopic images of their large intestines at day 5 post-infection showing shrunken cecum and shortened colon in p19A+DSS treated Sigirr -/- mouse as compared to E. coli DH10B+DSS treated mouse. Black scale bar, 1 cm. (d) A box and whisker plot showing colon length of E. coli DH10B+DSS or p19A+DSS treated Sigirr -/- mice. (e) Representative H&E staining images of ceca and colons of DSS-treated Sigirr -/- mice, previously infected with p19A or E. coli DH10B. Scale bar, 100 μm for (E) . (f) Histopathological scores from cecal and colonic tissues of mice used in (D). (g) Bioluminescence signals from the whole body and intestinal tissues (before and after wash with PBS) of mice used in (D) were imaged by in vivo imaging. (h) The numbers of p19A in ceca, colons and colonic lumen of WT and Sigirr -/- mice were determined at day 5 post-infection. These mice were pretreated with vancomycin for 6 h, and left unexposed (n = 6–9) or exposed to DSS treatment (n = 7–10) at day 1 post p19A infection. Data are representative of two independent experiments. ***p < .001, ****p < .0001.
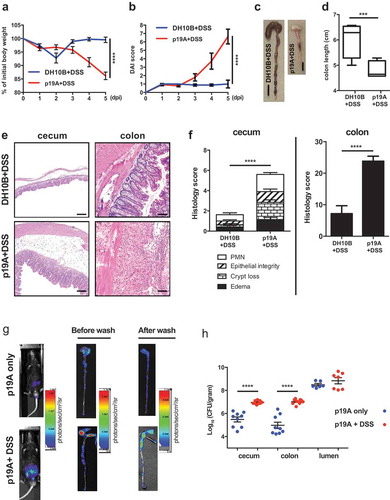
Figure 3. p19A’s ability to worsen DSS-induced colitis depends on two hemolysin genes
(a and b) Vancomycin-pretreated Sigirr -/- mice were infected with E. coli DH10B (n = 8), p19A (n = 8) or ∆hlyI∆hlyII (a p19A derived strain lacking hlyI and hlyII) (n = 5) for 1 day, then exposed to 2.5% DSS in drinking water for another 4 days, and their body weight (a) and disease activity index (b) were recorded daily. Data are representative of three independent experiments. (c) Representative macroscopic images of the large intestines of mice at day 5 post-infection are shown in the left panel, and a box and whisker plot showing the colon length of these mice is displayed in the right panel. Black scale bar, 1 cm. (d) Representative H&E stained images of ceca and colons of DSS-treated Sigirr -/- mice previously infected with E. coli DH10B, p19A or ∆hlyI∆hlyII. Scale bar, 100 μm. (e) Histopathological scores from cecal and colonic tissues of mice used in (D). (f) The number of wild type p19A or ∆hlyI∆hlyII present in the stool was determined at day 5 post-infection. Data are representative of two independent experiments. *p < .05, **p < .01, ***p < .001, ****p < .0001.
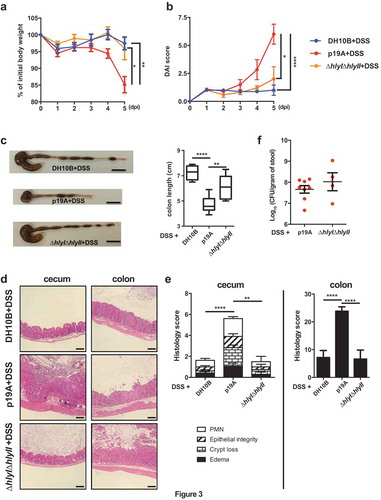
Figure 4. p19A’s potentiating effects on colitis depend on the adhesin FimH
(a) Vancomycin-pretreated Sigirr -/- mice were infected with E. coli DH10B (n = 5), p19A (n = 6) or ∆fimH (a p19A derivative strain lacking fimH) (n = 4) for 1 day, then exposed to 2.5% DSS in drinking water for another 4 days, and their body weight was recorded daily. (b) Disease activity index of Sigirr -/- mice as described in (A). Data are representative of three independent experiments. (c) Representative macroscopic pictures of the large intestines of Sigirr -/-mice as described above at day 5 post-infection (left panel), and a box and whisker plot showing the colon lengths of these mice (right panel). Black scale bar, 1 cm. (d) Representative H&E staining images of the ceca and colons of DSS-treated Sigirr -/- mice previously infected with E. coli DH10B, p19A or ∆fimH. Scale bar, 100 μm. (e) Histopathological scores of the ceca and colons from mice used in (D). (f) The number of p19A (n = 6) or ΔfimH (n = 3–4) bacteria in the stool was determined at day 1 and 5 post-infection. (g) Localization of p19A and ∆fimH in ceca of mice used in (A). p19A and ∆fimH bacteria were visualized by immunofluorescent staining with anti-actin (red) and anti-LPS (green). The nuclei were stained with DAPI (Blue). Scale bar, 20 μm. Data are representative of two independent experiments. **p < .01, ***p < .001, ****p < .0001.
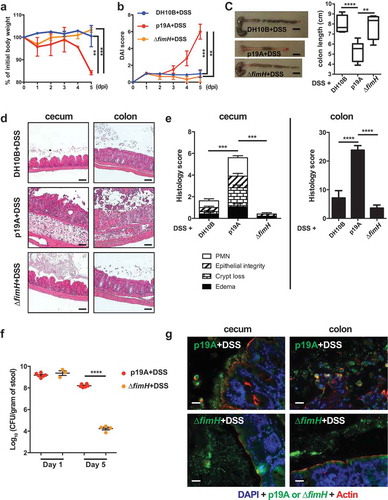
Figure 5. FimH antagonists prevent p19A from aggravating DSS-induced colitis
(a) Vancomycin-pretreated Sigirr -/- mice were uninfected, or infected with p19A for 1 day, then exposed to 2.5% DSS in drinking water for another 4 days. Also, the FimH antagonists 1A-HM and 7 CD-HM were orally gavaged into mice at 2 h post-infection, as well as on day 1, 2, and 3 post-infection. The body weights of these mice were recorded daily (n = 6, 5, 8 and 8, for mice receiving DSS only, DSS+p19A, DSS+p19A+1A-HM, and DSS+p19A+7 CD-HM, respectively). (b) Disease activity index of Sigirr -/- mice as described in (A). (c) Left panel, representative macroscopic pictures of the large intestines of Sigirr −/-mice as described above; Right panel, a box and whisker plot showing the colon lengths of these mice. Black scale bar, 1 cm. (d) Representative H&E staining images of the ceca and colons of DSS-treated Sigirr -/- mice that were previously infected with p19A and orally gavaged with the FimH antagonists 1A-HM or 7 CD-HM. Scale bar, 100 μm. (e) Histopathological scores of ceca and colons from mice used in (D). (f) The numbers of p19A bacteria in ceca and colons of mice receiving DSS+p19A (n = 6–12), DSS+p19A+1A-HM (n = 6–9), or DSS+p19A+7 CD-HM (n = 6–9), were determined at day 5 post-infection. Data are representative of three independent experiments. *p < .05, **p < .01, ***p < .001, ****p < .0001.
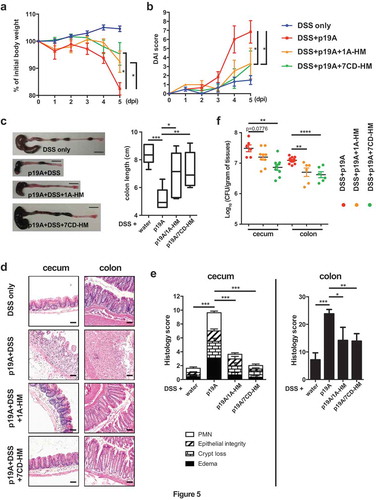
Table 1. Primers used for qPCR and construction of mutants
Supplemental material
Supplemental Material
Download Zip (22.8 MB)Data availability statement
All data generated and reagents are available from the corresponding author on reasonable request.