Figures & data
Figure 1. Experimental workflow for determining the direct impact of POPs on bacteria. (a) Scheme for determining the physiologic, metabolic, and transcriptional impact of four POPs on isolated cecal bacteria and individual species. (b) Metatranscriptomics workflow analysis from isolated cecal bacteria with POPs exposure (created with BioRender.com). (c) Chemical structures of four POPs used in this study
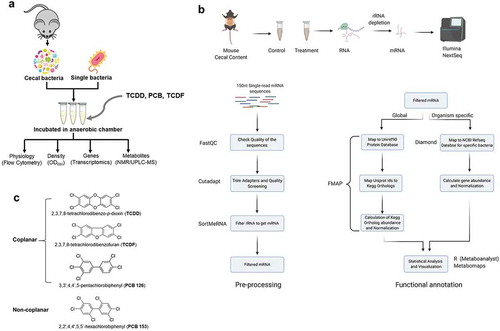
Figure 2. The physiological response of isolated cecal bacteria to POPs exposure in vitro. (a) Flow cytometric analyses of proportions of SybrGreen, low nuclei acid (LNA), and HNA-stained cells from isolated cecal bacteria with vehicle or two doses of POPs exposure for 4 h. (b) Flow cytometric analyses of proportions of CFDA, Pi, and DiBAC4-stained cells from isolated cecal bacteria with vehicle or two doses of POPs exposure for 4 h. Values are means ± S.D. (n = 4 per group). * P < .05, ** P < .01, *** P < .001 compare to vehicle
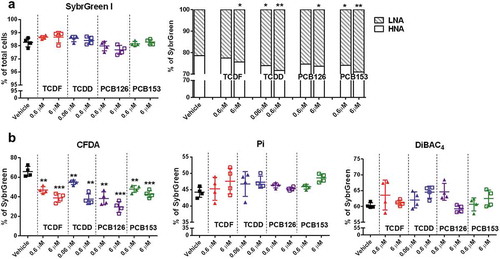
Figure 3. 1H NMR-based metabolomics analysis of isolated cecal bacteria in response to POPs exposure in vitro. (a) PCA score plots obtained from 1H NMR data of hydrophilic metabolite profiling for the isolated cecal bacteria with vehicle or two doses of POPs exposure for 4 h. (b) Heat map representation of relative content of hydrophilic metabolites from isolated cecal bacteria with vehicle or two doses of POPs exposure for 4 h. Red shades represent metabolites that are increased, and blue shades represent metabolites that are decreased. (c) PCA score plots obtained from 1H NMR data of lipid profiling for the isolated cecal bacteria with vehicle or two doses of POPs exposure for 4 h. (d) The relative levels for representative fatty acids from isolated cecal bacteria with vehicle or two doses of POPs exposure for 4 h. (n = 5 per group). * P < .05, ** P < .01, *** P < .001 compare to vehicle
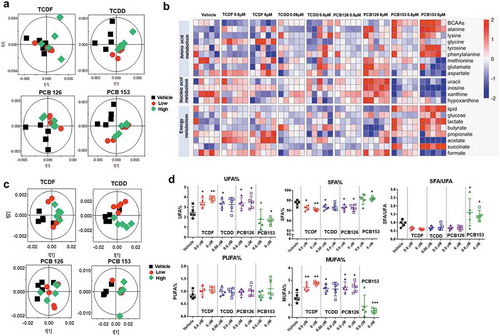
Figure 4. UPLC-MS/MS-based metabolomics analysis of lipid profiling from isolated cecal bacteria in response to POPs exposure in vitro. Heat map representation of the abundance of lipids from isolated cecal bacteria with vehicle or two doses of POPs exposure for 4 h from positive (a) and negative (b) modes. Red shades represent metabolites that are increased, and blue shades represent metabolites that are decreased. (n = 4 per group)
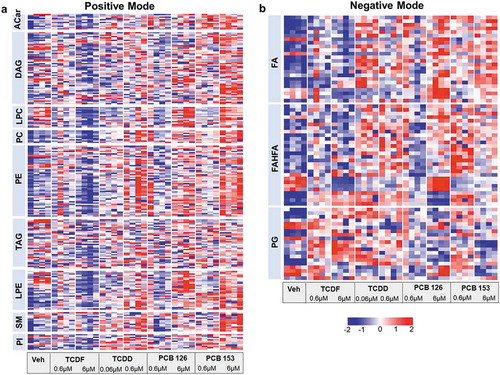
Figure 5. The transcriptional response of isolated cecal bacteria to POPs exposure in vitro. (a) PCA plot of gene expression of cecal bacteria with vehicle or POPs exposure for 4 h (p-value = 0.002 from each POP compared to vehicle). (b) The Number of differentially expressed gene orthologs for the isolated cecal bacteria with vehicle or POPs exposure for 4 h. (c) Number of pollutant-specific gene orthologs shared between each POP. (d) The gene orthologs significantly regulated in response to all four of POPs. (e) Integrated and visualized tricarboxylic acid (TCA) cycle using metatranscriptomics data combined with metabolomics data. (f) Integrated and visualized glycolysis pathway using metatranscriptomics data combined with metabolomics data. (n = 6 per group)
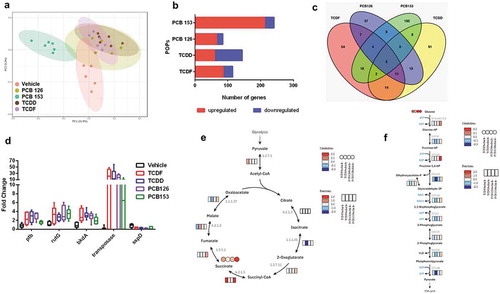
Table 1. Pathway enrichment analysis of metatranscriptomic data
Figure 6. The growth rate and physiological response of individual species to POPs exposure in vitro. (a-b) Growth rate of Bifidobacterium longum (a) and Lactobacillus paracasei (b) with vehicle or two doses of POPs exposure as measured by absorbance (OD600) over 18 hours.Values are means ± S.D. (n = 5 per group), *P < .05, ** P < .01, *** P < .001, lower dose compare to vehicle; # P < .05, ## P < .01, ### P < .001 higher dose compare to vehicle.(c-d) Flow cytometric analyses of proportions of SybrGreen, Pi, CFDA, and DiBAC4-stained cells from Bifidobacterium longum (c) and Lactobacillus paracasei (d) with vehicle or two doses of POPs exposure for 18 h. (n = 4). * P < .05, ** P < .01, *** P < .001, **** P < .0001 compare to vehicle
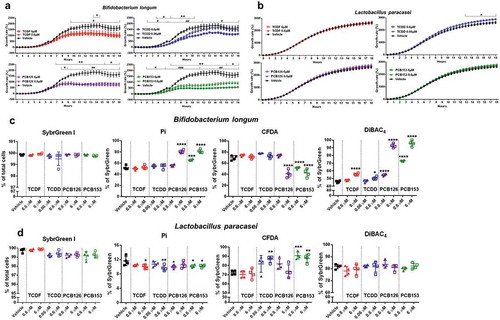
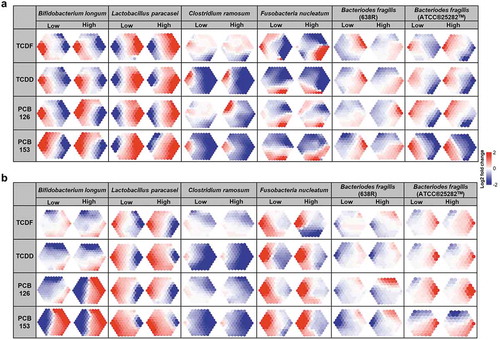
Figure 7. UPLC-MS/MS-based metabolomics analysis of lipid profiling from individual species to POPs exposure in vitro. Lipids were automatically arranged within an optimal supra-hexagon using the Suprahex package for R/Bioconductor. The map preserves the input information and provides the underlying cluster details such as the dimensionality, distribution, distance, clusters, and identity of metabolites (Supplementary Figure 7–18). The map also functions to place the most significantly changed metabolites on the outer portion of the map. MetaPrints based on the lipid profiling derived from UPLC-MS/MS positive (a) and negative (b) modes of Bifidobacterium longum, Lactobacillus paracasei, Clostridium ramosum, Fusobacteria nucleatum, Bacteriodes fragilis (ATCC®25282TM), and Bacteriodes fragilis (638 R), denoted as the log2 fold change relative to vehicle, following POPs exposure for 18 h. (n = 4 per group)