
Figures & data
Figure 1. Bile acid transformation by OligoMMCitation12 members and E. muris DSM 28560T. a) Deconjugation by the OligoMMCitation12 strains Bacteroides caecimuris DSM 26085, Bifidobacterium animalis DSM 26074, and Enterococcus faecalis DSM 32036. The insoluble free bile acids released by deconjugation are visible as precipitates (black arrowheads) or halos (white arrowheads) surrounding the bacterial cell layer on agar plates (see images). In liquid medium, positive reactions (+) are recognized via the formation of precipitates at the bottom of culture wells (black arrowheads) and/or jellification of the medium (striped arrowheads), which remains in wells after inverting the culture plate. As negative controls (-), OligoMMCitation12 strains were inoculated in medium without bile acids. b) Bile acids detectable by mass spectrometry before (T0) and after (T1) incubating E. muris for 48 h under anaerobic conditions with the respective bile acids, as indicated in the graphs. For the sake of clarity, delta-values (T1-T0) are presented on the y-axis; average concentrations at T0 are given below the x-axis for transparency. Incubations were performed in duplicates; single values are indicated with dots. c) Results of E. muris and complex microbial community incubated with mouse bile as described in detail in the methods section. The observed decrease in TCA was also observed in the negative control without bacteria and thus not due to E. muris, hinting at remnant BSH activity in the culture medium. The following bile acids were not detected in the respective incubation with CA: TCA, UDCA, LCA, ωMCA, βMCA; CDCA: TCA, CA, UDCA, DCA, ωMCA, βMCA; UDCA: TCA, CA, CDCA, DCA; and murine bile: UDCA, CDCA, LCA. d) Left-hand panel: Representative thin-layer chromatography depicting conversion of 100 µM CA by induced (I) or non-induced (NI) resting cells of E. muris DSM 28560T. Right-hand panel: Representative LC-MS chromatograms in single, negative ion monitoring mode overlaid with linked vertical axes of induced or non-induced E. muris reaction products compared to CA and DCA standards. Formula weight of CA is 408.57 atomic mass units (amu), DCA is 392.57 amu. Abbreviations: cholic acid, CA; deoxycholic acid, DCA
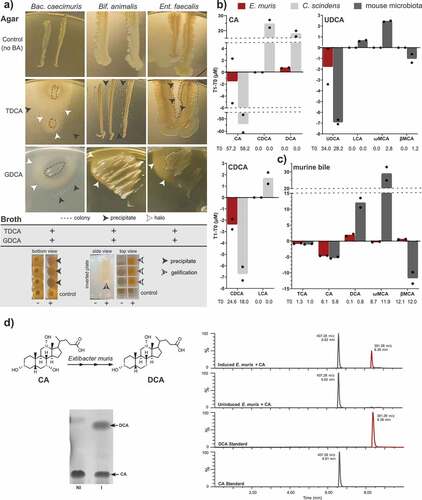
Figure 2. Stable colonization of E. muris in the intestine of OligoMMCitation12 mice. a) Beta-diversity analysis shown as multidimensional scaling plot of generalized UniFrac distances (p-value <0.001; PERMANOVA). Bacterial composition in the gnotobiotic mice shown as b) relative abundances obtained by high-throughput 16S rRNA gene amplicon sequencing, and c) absolute gene copy numbers obtained by species-specific, 16S rRNA gene-targeted qPCR assays. d) Comparison of relative abundances between qPCR and 16S rRNA gene amplicon sequencing shown as ratios of respective relative abundances. For ratios below one, reciprocal values were calculated. Data are plotted as mean values ± SD. Significance is indicated as follows: one symbol, p < .05; two symbols, p < .01; three symbols, p < .001 (two-way ANOVA followed by Tukey test). Stars indicate differences due to E. muris (blue vs. gray). Hashtags indicate differences due to diet (mean values for LF diet-fed mice are shown again in gray in the plots for HF diet-fed mice)
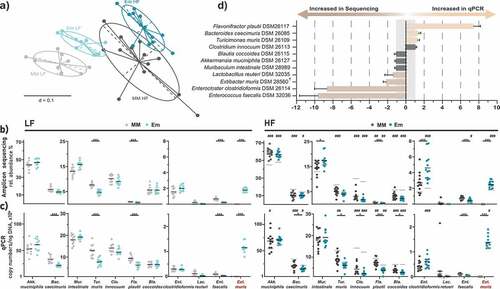
Figure 3. E. muris triggered 7α-dehydroxylation and further rearrangements of bile acids in vivo. a) Bile acid composition shown as percentages of total bile acids measured. The three main categories of bile acids considered were: PBA, free primary bile acids; conj. PBA, conjugated primary bile acids; SBA, secondary bile acids. Their respective average total amounts (in µmol/g cecal content, wet weight) are indicated in the corresponding stacked bar plots. b) Total bile acid concentrations. c) Concentrations of individual bile acids, shown in decreasing order: βMCA, β-muricholic acid; TβMCA, taurine-conjugated β-muricholic acid; TCA, taurine-conjugated cholic acid; CA, cholic acid; DCA, deoxycholic acid; ωMCA, omega-muricholic acid; TαMCA, taurine-conjugated α-muricholic acid; UDCA, ursodeoxycholic acid; TUDCA, taurine-conjugated ursodeoxycholic acid; TCDCA, taurine-conjugated chenodeoxycholic acid; LCA, lithocholic acid; CDCA, chenodeoxycholic acid; TDCA, taurine-conjugated deoxycholic acid; TωMCA, taurine-conjugated omega-muricholic acid; TLCA, taurine-conjugated lithocholic acid; γMCA, gamma-muricholic acid. Taurine-conjugated γMCA and glycine-conjugated bile acids were not detected. Data are shown and statistics performed as described in
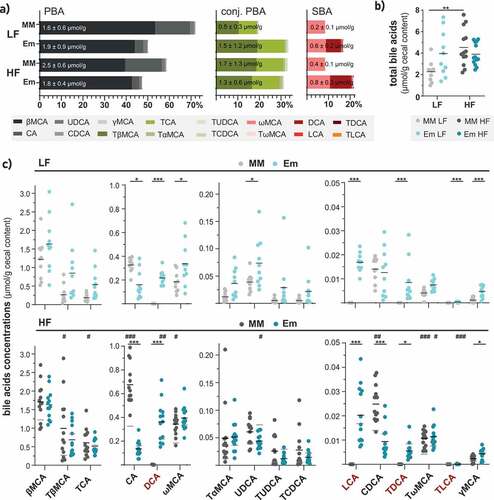
Figure 4. Liver proteomics. a) Volcano plots of proteins altered in mice colonized with E. muris compared to OligoMMCitation12 in the two dietary treatments. The stacked bar plots below show the corresponding fractions of altered proteins, with alterations due to diet (HF vs. LF) as the comparison. b) Metabolic pathways significantly altered by E. muris in mice fed a LF diet (p < .05; z-scores > 2.5). Corresponding z-scores for mice fed a HF diet are shown, with stars indicating significance. c) List of top-20 most and least abundant proteins (see definition in the methods) in E. muris-colonized mice vs. Oligo-MM12 control receiving the LF diet. Proteins are ordered by fold-changes. Gene accession numbers, KEGG orthologues (KOs) and eggNOG accession numbers are indicated next to the protein names. NA, not available
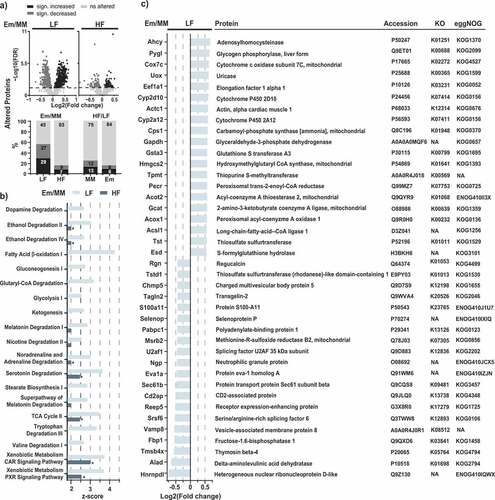
Figure 5. Total fatty acid analysis of liver samples. a) Principal component analysis (PCA) based on total FA profiles. b) Fatty acid distribution shown as percentages of total fatty acids quantified. Fatty acids categories were: SFA, saturated fatty acids; MUFA, monounsaturated fatty acids; and PUFA, polyunsaturated fatty acids. c) Total FA profile; fatty acids < 0.2% are not shown (C10:0, C15:0, C20:4 n-3, C20:5 n-3, C22:1 n-9). Data are plotted as mean values ± SD. *p < .05, **p < .01, ***p < .001 (two-way ANOVA followed by Tukey test)
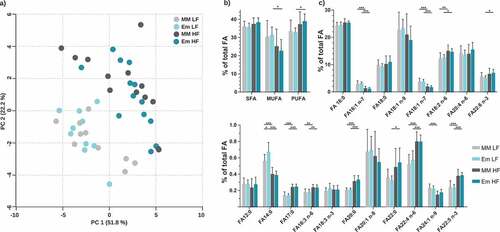
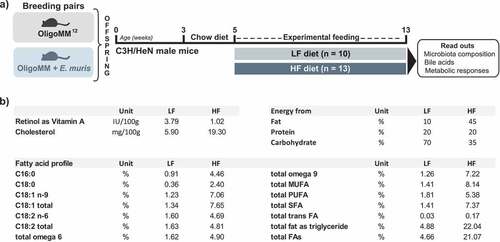
Figure 6. Experimental design and differential diet features. a) C3H/NeH male mice colonized from birth with the simplified community Oligo-MM12 with or without E. muris were fed two different diets from the age of 5 weeks on: (i) a control diet with low fat content (LF; 10% kcal from fat provided as lard; n = 10); (ii) a high-fat diet (HF; 45% kcal from fat; n = 13). The diets were fed ad libitum for a duration of 8 weeks. b) Major differences between the diets. All details are given in the methods section and in the Supplemental material. Abbreviations: MUFA, monounsaturated fatty acids; PUFA, polyunsaturated fatty acids; SFA, saturated fatty acids; FA, fatty acids
Supplemental Material
Download Zip (8.4 MB)Data availability
Illumina reads of the 16S rRNA gene amplicon analysis are available at the NCBI SRA database under the accession number PRJNA633540. The proteomics data were deposited to the ProteomeXchange Consortium with the dataset identifier PXD019973 via the PRIDE partner repository.Citation95 Raw lipidomics data will be made available by the corresponding authors upon reasonable request.