Figures & data
Figure 1. Study design for the whole experiment. (a) Schematic diagram of the fermented diet and probiotics administered to sows (n = 20). (b) Schematic diagram of the susceptibility of piglets to LPS-induced colonic inflammation (n = 6). (c) Schematic diagram of the effects of the transplantation of sows’ fecal microbiota on gut health in mouse dams and pups (n = 6). (d) Schematic diagram of the effects of LR and GLN on the gut health of mice (n = 6). (e) Schematic diagram of the effects of LR and GLN on inflammation in 3D4/2 and Caco-2 cells (n = 3). PBS, phosphate-buffered saline; LPS, lipopolysaccharides; FMT, fecal microbiota transplantation; LR, Lactobacillus reuteri; GLN, L-glutamine.
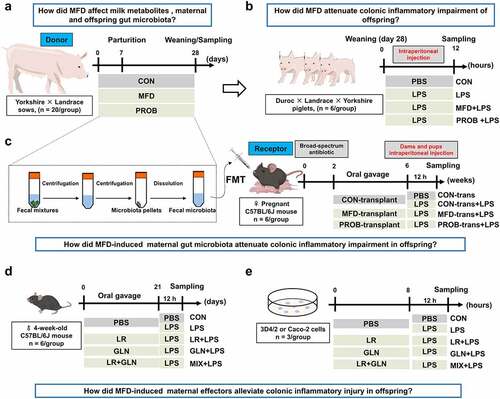
Figure 2. The effects of MFD on the gut microbiota and milk metabolome of sows (n = 6). (a) Chao1 index dilution curve of α-diversity. (b) Principal coordinates analysis (PCoA) boxplot of β-diversity based on the Unweighted unifrac distance (ANOSIM analysis, P < 0.001). (c) Distribution of significantly different gut microbe genera in individual sows (LEfSe analysis, LDA > 3.0). (d) Correlations between the MFD and sow gut microbiota. (e) sPLS-DA plot of maternal milk metabolites (ANOSIM analysis, P < 0.001). (f) Distribution of differential milk metabolites in individual sows based on Pearson distance and average clustering (VIP > 1.0, P < 0.05). (g) The significantly different metabolite-related metabolic pathways of milk metabolites. ***: P < 0.001, **: 0.001 < P < 0.01, *: 0.01 < P < 0.05 indicate significance.
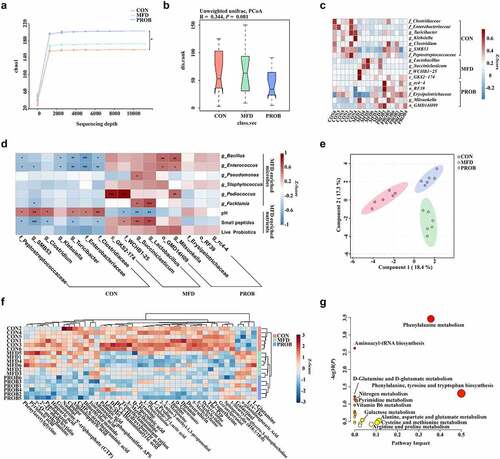
Figure 3. The effects of MFD on the longitudinal and horizontal assembly of early-life gut microbiota in piglets (n = 6). (a) Chao1 index of α-diversity. (b) PCoA plots of β-diversity based on the Bray–Curtis index (ANOSIM analysis, P < 0.001). (c) Area plots at the phylum on days 7, 14 and 28. (d) Maturation curve of gut microbiota. (e) Distribution of significantly different gut genera in offspring individuals on day 28 (LEfSe analysis, LDA>3.0).
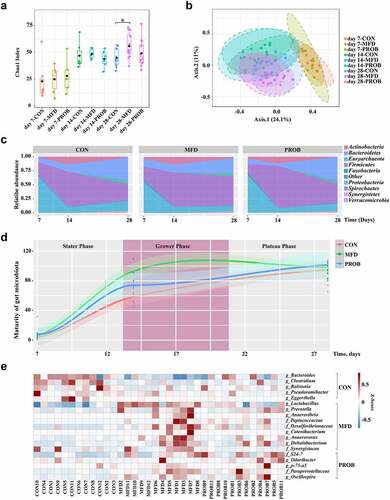
Figure 4. The impacts of an MFD on the susceptibility of piglets to LPS-induced colonic epithelial inflammation (n = 6). (a) Colonic histological morphology images and pathological scores. Scale bar of hematoxylin and eosin staining images: 200 μm; scale bar of scanning electron microscope (SEM) images: 1 μm; scale bar of transmission electron microscope (TEM) images: 0.2 μm. (b) Images of immunofluorescence of ZO-1 and β-catenin. (c) Colonic tight junction protein expression. (d) TUNEL image and statistical analysis. (e) Apoptosis-related protein expression in the colon. (f) M1 and M2 macrophage surface protein expression in colon. (g) Colonic cytokines. ***: P < 0.001, **: 0.001 < P < 0.01, *: 0.01 < P < 0.05 indicate significance.

Figure 5. The effects of maternal FMT from MFD-fed sows on the susceptibility of mouse dams and pups to LPS-induced colonic epithelial inflammatory impairment (n = 6). (a) β-diversity of dam gut microbiota based on Bray–Curtis index (ANOSIM analysis, P = 0.049). (b) Distribution of differentially abundant genera in the gut of mouse dams (LEfSe analysis, LDA>3.0). (c) Colonic histological morphology images of dams and pathological scores. Scale bar of hematoxylin and eosin staining images: 200 μm; scale bar of scanning electron microscope (SEM) images: 1 μm; scale bar of transmission electron microscope (TEM) images: 0.2 μm. (d) Colonic tight junction protein expression of dams. (e) β-diversity of pup gut microbiota based on Bray–Curtis index (ANOSIM analysis, P = 0.007). (f) Distribution of differentially abundant genera in the gut of mouse pups (LEfSe analysis, LDA>2.5). (g) Colonic histological morphology images of pups and pathological scores. Scale bar of hematoxylin and eosin staining images: 200 μm; scale bar of scanning electron microscope (SEM) images: 1 μm; scale bar of transmission electron microscope (TEM) images: 0.2 μm. (h) Colonic tight junction protein expression of pups. ***: P < 0.001, **: 0.001 < P < 0.01, *: 0.01 < P < 0.05 indicate significance.
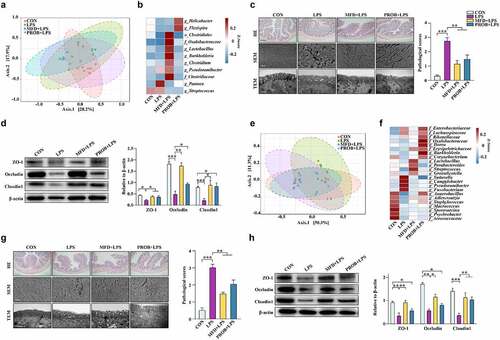
Figure 6. The sow’s effectors that contribute to piglets gut health (n = 6). (a) Correlations between sow gut microbiota and piglet gut microbiota based on Pearson coefficient. (b) Correlations between milk metabolites and piglet gut microbiota based on Pearson coefficient. (c) Correlations between piglet gut microbiota and piglet serum indexes based on Pearson coefficient. (d) The relative abundance of the most differentially abundant OTUs in both the sow and piglet gut microbiota and the concentration of GLN in the milk. (e) The absolute concentration of milk GLN. (f) The absolute quantity of fecal LR of sow and piglets. (g) The absolute quantity of LR in thesupernatant of the MFD in vitro fermentation system. ***: P < 0.001, **: 0.001 < P < 0.01, *: 0.01 < P < 0.05 indicate significance.
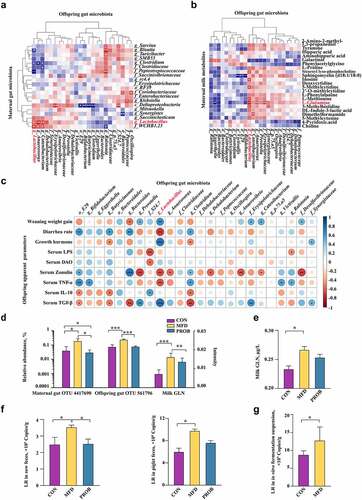
Figure 7. Validation of the effects of LR and GLN on LPS-induced inflammatory injury in the colon of mice (n = 6). (a) β-diversity of gut microbiota based on Bray–Curtis index (ANOSIM analysis, P < 0.001). (b) Distribution of differentially abundant gut microbe genera in mice (LEfSe analysis, LDA>3.0). (c) Colonic histological morphology images and pathological scores. Scale bar of hematoxylin and eosin staining images: 200 μm; scale bar of scanning electron microscope (SEM) images: 1 μm; scale bar of transmission electron microscope (TEM) images: 0.2 μm. (d) Colonic tight junction protein expression. (e) Colonic cytokines. ***: P < 0.001, **: 0.001 < P < 0.01, *: 0.01 < P < 0.05 indicate significance.
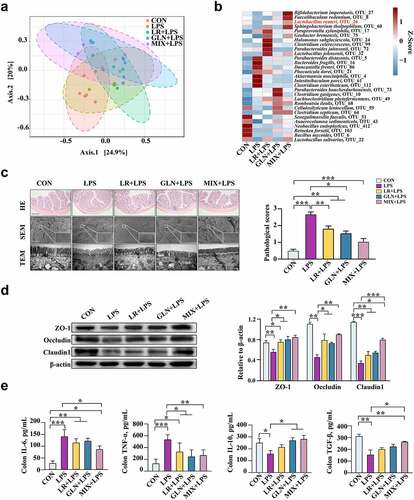
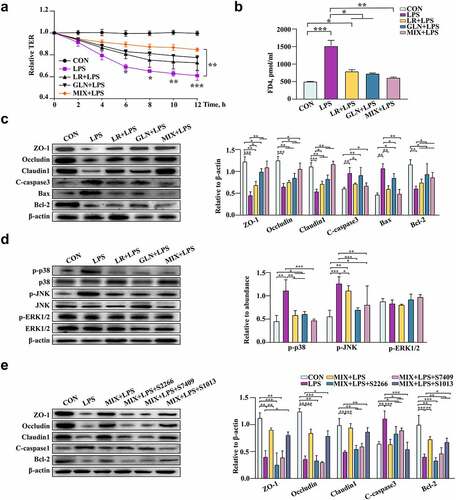
Figure 8. Validation of the effects of LR and GLN on LPS-induced inflammatory injury in cells (n = 3). (a) Changes in the relative TER values of Caco-2 cells for the completely differentiated monolayer; (b) FD4 content in lower compartments of Transwell plates. (c) Tight junction and apoptosis-related protein expression in Caco-2 cells. (d) p38, JNK and ERK1/2 phosphorylation in Caco-2 cells. (e) The tight junction and apoptosis-related protein expression when Caco-2 cells were treated with specific activators of p38, JNK and ERK1/2. ***: P < 0.001, **: 0.001 < P < 0.01, *: 0.01 < P < 0.05 indicate significance.