Figures & data
Figure 1. Gut habitats, niches, and ω-3 supplementation as the main explanatory variables to the microbiota community structure at the genus level, in the M-SHIME®. (a) Schematic representation of the different gut habitats and niches recreated in the M-SHIME®. (b-d) Type II scaling triplots obtained using partial distance-based redundancy analysis (db-RDA) of the microbial community composition detected using 16S rRNA gene amplicon sequencing. Treatment condition (b), gut habitat (c) and lumen (l)/mucus (m) niche (d) were set as explanatory variables (in blue) and abundances of genera as response variables (purple arrows). Only the top ten genera were displayed for adequate visibility. Axes are annotated with their contribution to the total variance. “Vexplained” indicates the variability in the gut microbiota composition explained by the variables condition, gut habitat, and lumen/mucus niches. ***indicate the p < .001 significance of the observed group separation, as assessed with a Permutational Multivariate Analysis of Variance (PERMANOVA) using distance matrixes. (e) Genus level relative abundance of the luminal (on top) and mucosa-associated (bottom) microbiota composition following a 1-week control (C; blue lines) versus 1-week ω-3 treatment (T; Orange lines) at indicated days across the successive gut habitats/niches. For technical reasons (see Methods), mucin beads containing mucosa-associated microbiota were sampled 2 times under each condition. The barplots represent the mean composition of four replicates. The 20 most abundant genera are represented.
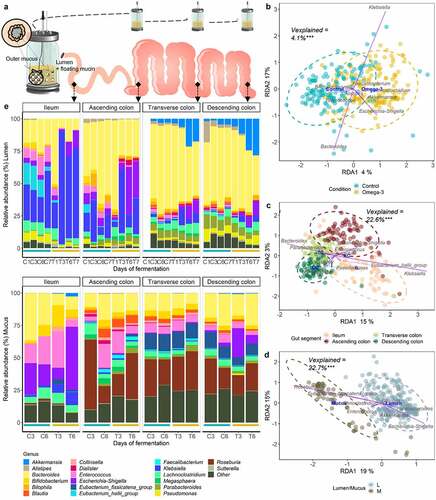
Table 1. EPA and DHA capsules content. Concentration of different lipids in the capsule based on the products specification’s sheets provided by K.D.-Pharma Bexbach Gmbh.
Table 2. Spatial-temporal fate of EPA/DHA during M-SHIME® fermentation. Concentrations of EPA and DHA as free acids in each gut habitat cumulated over 1 week supplementation is indicated in pmol and gradual amount is illustrated in Orange. EPA and DHA levels are depicted in Orange. T0h refers to the sampling time point before the addition of EPA-DHA in the stomach vessel, deprived of microbiota. Only ileum and colon habitats harbor microbes. Purple arrows indicate the transfer between vessels: stomach and ileum fully empty their contents to follow a given transit time, while colon vessels partially empty their contents to follow a given hydraulic residence time. SI = small intestine.
Figure 2. Contrasting response to ω-3 supplementation between luminal/mucus-associated microbiota in the M-SHIME®. (a) Evolution of Shannon diversity index following a 1-week control versus 1-week ω-3 supplementation across the successive gut habitats/niches (n = 4 replicates). * represent the p < .05 significant differences with control based on Wilcoxon Rank Sum tests with Holm’s correction (α = .05). (b-e) Volcano plots indicating the genera significantly enriched by the ω-3 supplementation in the transverse (b and d) and descending (c and e) gut habitats of the luminal and mucosa-associated (m) niches of the M-SHIME®. A positive log2 fold-change indicates a stimulation of the genus under the ω-3 supplementation period (in Orange) while a negative log2 fold-change indicates a decrease of the genera compared to the control period (in blue), as determined by Deseq2 analysis. Statistical differences between the control and ω-3 PUFA supplementation across gut habitats were determined using a Wald Test. The log transformed adjusted p-value is displayed on the y-axis and the α = .05 significance level is indicated by a dashed line.
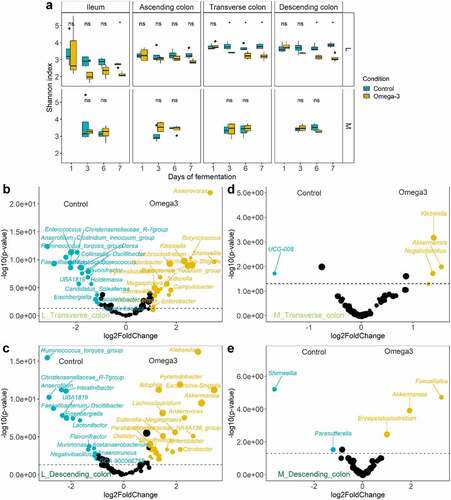
Figure 3. Mucolytic bacteria of luminal floating mucin habitats dynamically shifted following the ω-3 supplementation. (a-c) Selection of mucolytic bacteria that displayed significant differences in ASVs level abundance between control and ω-3 supplementation, as assessed by DESeq2 analysis in the different gut habitats and over time (gradient of colors). Statistical differences between the control and ω-3 PUFA supplementation across gut habitats were determined using a Wald Test. (d) Phylum level relative abundance of the luminal microbiota composition following a 1-week control (C) versus 1-week treatment (T) across the successive gut habitats. Control and treatment conditions are demarcated in blue and Orange lines, respectively. The barplots represent the mean composition of four replicates.
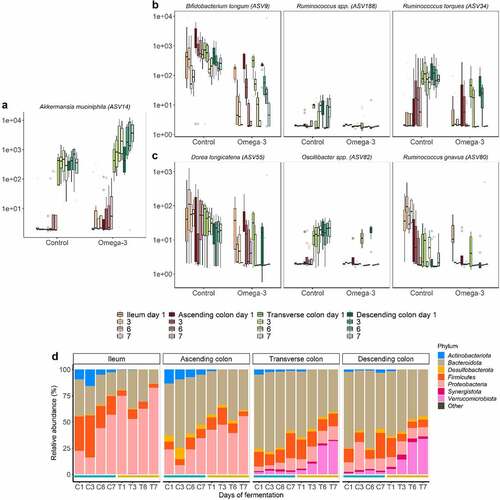
Figure 4. Temporal depletion of genera in luminal floating mucin habitats following the ω-3 supplementation. Bacteria displaying significant differences in genus level abundance between control and ω-3 supplementation, as assessed by DESeq2 analysis in the different gut habitats and over time (gradient of colors). Statistical differences between the control and ω-3 PUFA supplementation across gut habitats were determined using a Wald Test. Colored labels indicate the class of the respective genera. Scissors indicate the genus known for their mucolytic functions.
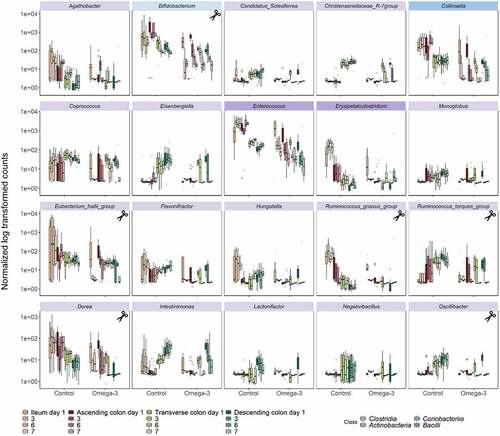
Figure 5. Temporal stimulation of genera in luminal floating mucin habitats following the ω-3 supplementation. Bacteria displaying significant differences in genus level abundance between control and ω-3 supplementation, as assessed by DESeq2 analysis in the different gut habitats and over time (gradient of colors). Statistical differences between the control and ω-3 PUFA supplementation across gut habitats were determined using a wald test. colored labels indicate the class of the respective genera.
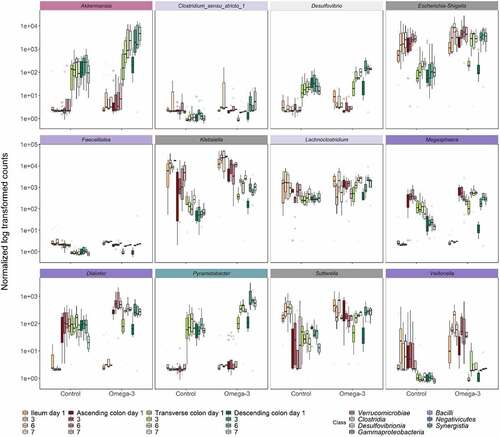
Figure 6. SCFA modulation under ω-3 supplementation. Mean concentrations of major (a) and minor (b) SCFAs in the 4 replicates ± SD across each luminal gut habitat in control (C; blue lines) and treated (T; Orange lines) at different days. Statistically significant differences between control period and ω-3 supplementation are denoted for p < .05 (*), p < .01 (**), and p < .001 (***) as determined by Pairwise Wilcoxon rank sum tests with holm correction.
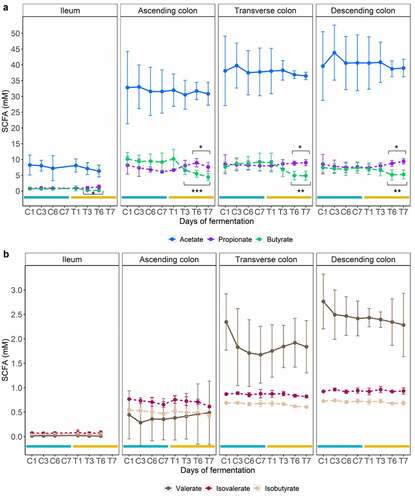
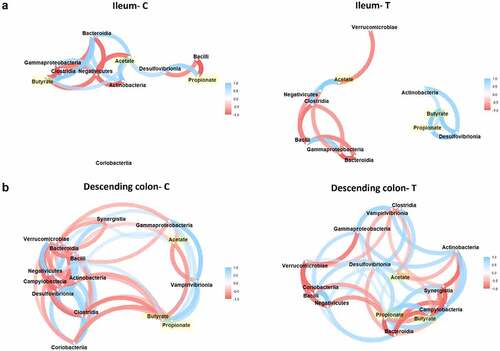
Figure 7. Associations between class taxa and SCFA concentrations in habitats and treatment-dependent fashion. Correlation networks illustrating the Spearman correlations between the SCFA produced under control (c) vs. ω-3 supplementation (t) and their corresponding class enrichment in opposed environments displayed in the luminal ileum (a) and descending colon (b). Gradient color, distance, and thickness of the lines were applied to nodes depending on coefficients of correlation. Only significant nodes that are upper to a coefficient of correlation of 0.5 or −0.5 are shown. Negative and positive correlations are denoted in shades of red and blue, respectively. SCFA nodes are highlighted in yellow.