Figures & data
Figure 1. 5-hydroxyindole has a marginal effect on the cecal microbiota in wild-type Groningen rats. (a) Comparison of cecal microbiota alpha diversity between 5-hydroxyindole-treated group (red bars) and vehicle-treated group (gray bars), including species richness (represented by Chao1 and Observed OTUs) and diversity (represented by Shannon and Simpson index). Data were analyzed using the Mann Whitney test (P value is indicated above the box plots; ns = not significant). Error bars represent SEM. The alpha diversity data can be found in Table A in S1 Table. (b) Principal component analysis (PCA) indicates no separation of 5-hydroxyindole-treated and vehicle-treated groups. Top 10 most contributing species are shown in the figure. The rest of the supporting data for the PCA analysis can be found in Table E and F in S1 Table. (c) LEfSe (Linear discriminant analysis Effect Size) for the 5-hydroxyindole-treated group. The length of the bar represents the log10 transformed Linear discriminant analysis (LDA) score for genera significantly changed in the 5-hydroxyindole-treated group, indicated by vertical dotted lines. (d) Difference in the abundance of the Prevotellaceae_UCG-001 and Shuttleworthia genera in the 5-hydroxyindole-treated (red bars) and vehicle-treated (gray bars) groups. Left panel represents means in groups. Right panel represents differences between groups, where each dot is colored by its FDR value < .05. Significance was assessed by multiple comparison correction. Error bars represent SEM.
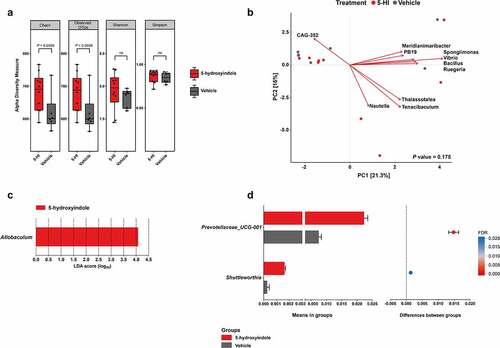
Table 1. Bacterial taxa on the genus level that were affected by the 5-hydroxyindole treatment. Significance was assessed by multiple comparison correction (FDR < .05). Marginal effect was assessed by unpaired t-test (P value < .05).
Table 2. Spearman correlations of bacterial taxa on the genus level that were marginally affected by the 5-hydroxyindole treatment.
Figure 2. 5-hydroxyindole potentially binds to the α1 subunit of the L-type voltage-gated calcium channels. (a) Representation of the simulation box used as initial configuration for the molecular dynamics simulations. The system contains CG models of L-type voltage-gated calcium channel CaV1.1 complex embedded in a POPC bilayer. Solvent and ions are represented explicitly with 30 copies of 5-hydroxyindole (one of the ligands used for the study) were randomly placed in the water solution. (b – c) Schematic representation of L-type voltage-gated calcium channels (LTCCs) (b) and diagram of LTCCs topology (c). Adapted fromCitation14,Citation15,Citation17 (Created with BioRender.com). VSD, voltage sensing domain; PD pore domain; I–IV, four domains of α1 subunit; S1-S6, segments 1–6; P1-P2, supporting helices P1 and P2. (d – f) 5-hydroxyindole density obtained in the CG MD simulations projected on top of the cryo-EM structure of the L-type voltage-gated calcium channel Cav1.1 complex bound to nifedipine (pdb 6JP5). An overview of the whole structure of the complex, showing the backbone of the different subunits, with the pore-forming subunit α1 in blue and auxiliary subunits α2δ, β, and γ in Orange, red, and gray, respectively. Nifedipine is shown in yellow. Isosurfaces corresponding to a 1,000-fold higher than the environment are also displayed. Densities obtained from simulations starting from 6JP5 are shown in green while the data obtained with 3JBR is displayed in pink (d). Close look of the pockets in the pore-forming subunit α1 (e). Main residues of subunit α1 that are around nifedipine and of pockets p1 and p2 of 5-hydroxyindole (f). (g – h) Comparison of concentration-response curves of nifedipine alone (black) and 100 µM 5-HI + nifedipine (red) (g) and concentration-response curves of nifedipine alone (black) and 3 µM Bay K 8644 (red) (h). The response was normalized to maximum response and expressed as percentage. Concentration-response curves were fitted with nonlinear fit (Sigmoidal dose-response (variable slope)) and compared with Extra sum-of-squares F test (*** p < .001). Error bars represent SEM.
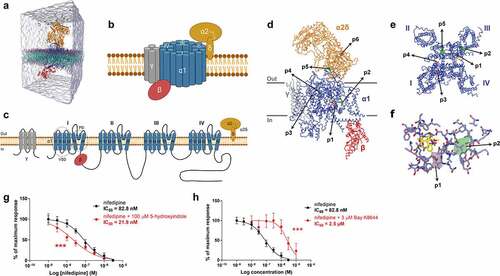
Figure 3. 5-hydroxyindoles analogues have various effects on rat colonic contractility. (a) Chemical formulations of 5-hydroxyindole analogues. Top formula shows 5-hydroxyindole and structure-activity relationship based on 5-hydroxyindole. The hydroxyl-group dance on the indole core at the 4, 6, 7-position is highlighted by the Orange color. The 5-position is highlighted by the magenta color. The 2- and 3-position of the indole core which are prone to various electrophilic additions is highlighted by the green color. Formulas below show 5-hydroxyindoleCitation1 analogues: 4-hydroxyindole;Citation2 6-hydroxyindole;Citation3 7-hydroxyindole;Citation4 5-aminoindole;Citation5 5-methoxyindole;Citation6 5-ethoxyindole;Citation7 5-hydroxyindole-3-acetic acid;Citation8 5-hydroxyindole-2-carboxylic acid;Citation9 5-hydroxyoxindole;Citation10 5,6-dihydroxyindole;Citation11 Indole;Citation12 Indole-3-acetic acid;Citation13 Indole-2-carboxylic acid;Citation14 Indole-3-carboxaldehyde;Citation15 (1 H-Indol-3-yl)methanamine;Citation16 1-methylindole.Citation17 (b) Analogues of 5-hydroxyindole and their effect on the rat colonic contractility normalized to the respective baselines (n = 5–12; number of rat tissues used for each experiment). Red bars represent stimulants and blue bars represent inhibitors of the rat colonic contractility and white bars represent analogues with no effect. Data were analyzed using the Wilcoxon matched-pairs (before/after) signed rank test (*p < .05; **p < .01; **** p < .0001). Error bars represent SEM. Abbreviations: SAR, structure–activity relationship.
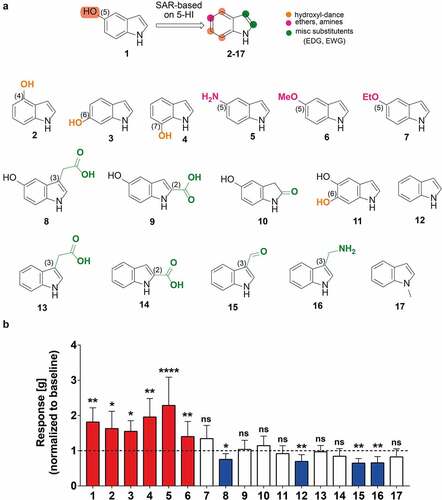
Figure 4. 5-hydroxyindole is the most potent stimulant of the rat colonic contractility among the other tested hydroxyindoles and their analogues. (a – f) Comparisons of concentration-response curves (n = 6–9; number of rat tissues used for each experiment) of 5-hydroxyindole (black) and 4-hydroxyindole (green) (a), 5-hydroxyindole (black) and 6-hydroxyindole (red) (b), 5-hydroxyindole (black) and 7-hydroxyindole (Orange) (c), 5-hydroxyindole (black) and 5-methoxyindole (blue) (d), 5-hydroxyindole (black) and 5-aminoindole (purple) (e) and 5-aminoindole (purple) and 5-methoxyindole (blue) (f). In each panel, the response was normalized to maximum response and expressed as percentage. Each graph contains the chemical formulas of the studied molecules in the upper panel of each graph. Concentration-response curves were fitted with a nonlinear fit (Log(Gaussian)) and compared with Extra sum-of-squares F test (*p < .05; **p < .01; *** p < .001). Error bars represent SEM. (h) The effect of 5-hydroxyindole, 4-hydroxyindole, 6-hydroxyindole, 7-hydroxyindole, 5-methoxyindole and 5-aminoindole on the rat colonic contractility normalized to the maximum KCl-induced response (n = 6–7; number of rat tissues used for each experiment). Data were analyzed using the Wilcoxon matched-pairs (before/after) signed rank test (*p < .05; **p < .01; ns = not significant). Error bars represent SEM.
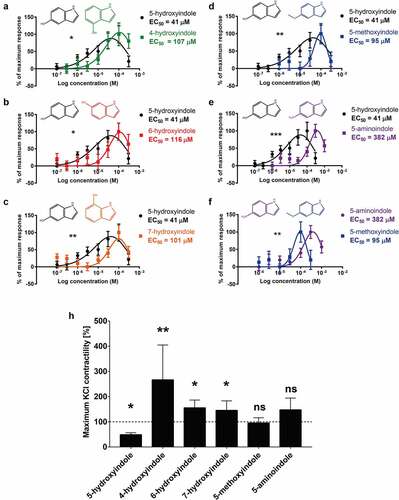
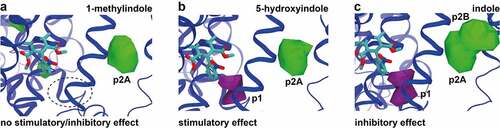
Figure 5. Comparison of 5-hydroxyindole possible binding sites in L-type voltage-gated calcium channels to other 5-hydroxyindole analogues. (a – c) Comparison of the pockets observed for all the ligands with no stimulatory/inhibitory effect (1-methylindole) (a), stimulatory effect (5-hydroxyindole) (b) and inhibitory effect (indole) (c) in subunit α1 that are around nifedipine (molecular structure in cyan color). Pockets p1 and p2 (p2A and p2B) are showed in purple and in green, respectively.