
Figures & data
Figure 1. Experimental design and the integrated analysis of adenoma-associated microbiome. (a) Experimental design. A total of 622 samples comprising 183 colorectal adenoma patients and 439 healthy controls were included in the discovery dataset. WMS data were then processed consistently to establish cross-cohort multimodal biomarkers and diagnostic models via xMarkerFinder. Further, the external validation dataset (128 samples) and datasets of other microbiome-linked diseases were used to independently assess the robustness and disease specificity of established biomarkers and diagnostic models. (b) The PERMANOVA test identified “cohort” as the major confounder and demographic indices (gender, age, and BMI) as minor confounders. Asterisks: statistical significance (*P < .05; **P < .01; ***P < .001). (c) Principal coordinate analysis (PCoA) of microbial taxonomic classifications showing that gut microbiota differed between adenoma patients and healthy controls (P = .001). P values of beta diversity based on Bray–Curtis distance were calculated with PERMANOVA test. Each point in the PCoA plots represents a sample and the colors of points represent different groups. (d, e) Phylogenetic trees showing the differential bacterial ((d) 110 in total) and fungal ((e) 216 in total) species. The outer circles are marked for significant differential species (P < .05) in each cohort identified via Maaslin2 and in the meta-analysis identified via MMUPHin (META ring). Orange and blue indicate increased and decreased abundance of the species, respectively.
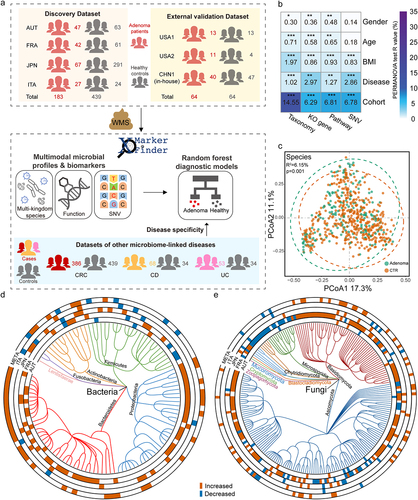
Figure 2. Adenoma-associated microbial functional alterations. (a) PCoA of microbial functional KO genes showing that gut microbiota differed between adenoma patients and healthy controls (P = .014). P values of beta diversity based on Bray–Curtis distance were calculated with PERMANOVA. Each point in the PCoA plots represents a sample and the colors of points represent different groups. (b) Volcano plot showing the differential KO genes in all samples identified via MMUPHin. Each point represents a KO gene. Coefficient > 0, P < .05 (in red): genes significantly more abundant in adenoma compared with control; Coefficient < 0, P < .05 (in blue): genes significantly less abundant in adenoma compared with control; P > .05 (in gray): non-differential genes. (c) The box plots (left) show the relative abundances of pathways in adenoma (red) and control (blue). Heatmap (right) shows the abundances of relevant differential KO genes in each of the four cohorts. Coefficient values were calculated via MaAsLin2 in each cohort and MMUPHin in meta-analysis with red for down-expression and blue for over-expression in adenoma patients compared with healthy controls. Only P values <.05 are shown in the cells.
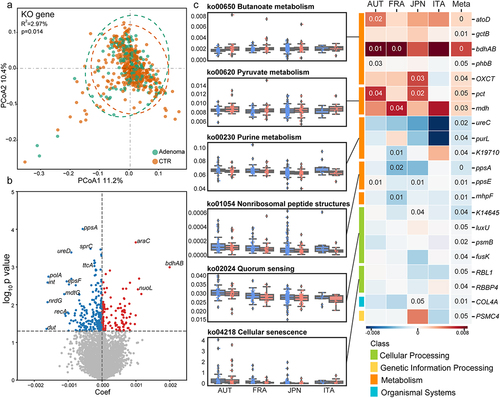
Figure 3. Microbial SNV signatures in adenoma. (a) Genomic locations of SNVs in the strains of F. prausnitzii (61481) and B. vulgatus (57955). Yellow outer rings represent the contigs of the reference genomes of the annotated strains. SNV frequencies in adenoma and control were indicated by blue lines in the second and third rings, respectively. The fourth ring indicates locations of identified differential SNVs (brown lines). (b) Bar plots showing the number of differential SNVs that belongs to each functional pathway with orange indicating previously established differential pathways. (c) Mapping of two differential SNVs located in differential genes. Mutated nucleotides (red) and corresponding amino acids were shown. The average SNV coverage of the two strains was provided.
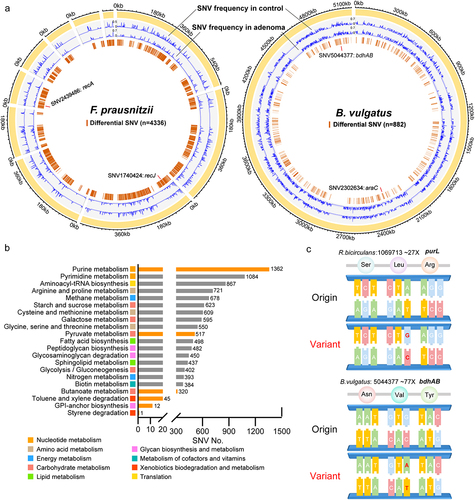
Figure 4. Diagnostic models based on microbial multimodal biomarkers. (a) The workflow of “Triple-E” feature selection procedure in xMarkerFinder. (1) Feature Effectiveness Evaluation. The differentially abundant signatures were identified using MMUPHin out of all multimodal signatures. Each single differential signature was then used to build an RF model with GroupKfold cross-validation and signatures with AUC values above 0.5 were defined as “effective features”. (2) Collinear Feature Exclusion. For all effective features, only those with absolute values of Spearman’s rank correlation coefficients less than 0.7 were reserved as “uncorrelated-effective features”. (3) Recursive Feature Elimination. The recursive feature elimination method was utilized to determine the “optimal biomarkers” as the best panel of features used for model construction. (b) Receiver operating characteristic (ROC) curve of the optimized models constructed with species-level biomarkers. Mean AUC and standard deviation of stratified fivefold cross-validation were shown. (c) Permutation feature importances of the optimized model constructed with multi-kingdom species-level features. Color represents different kingdoms. (d) ROC curve of the optimized models constructed with KO gene-level biomarkers. Mean AUC and standard deviation of stratified fivefold cross-validation were shown. (e) The upper plot showing the performances of single-strain SNV models and the multi-strain SNV model. Bar plot shows the mean coverage of each strain across all samples in the discovery dataset. The log-transformed numbers of annotated SNVs and differential SNVs in each strain are color-coded and indicated below the bar plot. (f) Box plot showing the cross-validation AUC values of models constructed with the combination of multimodal biomarkers. Mean AUCs and standard deviations are shown. (g) The process of selecting the minimal panel of SNV biomarkers with the inner plot showing the ROC curve of the minimal panel of SNV biomarkers.
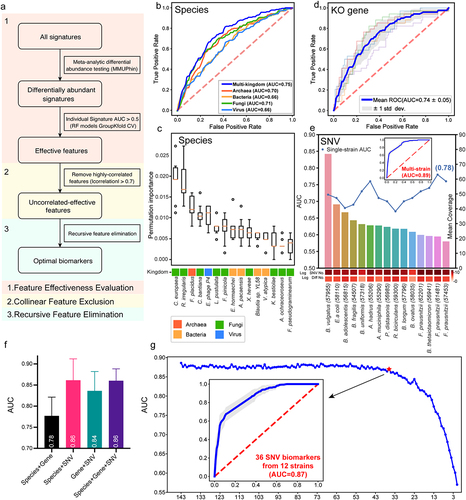
Figure 5. Characterization and validation of the best panel of SNV biomarkers. (a) SNV biomarkers’ distribution in each cohort and in meta-analysis. Heatmap of the coefficient values calculated via MaAsLin2 in each cohort or via MMUPHin in meta-analysis, with red for higher frequencies and blue for lower frequencies in adenoma patients compared with healthy controls. Asterisks indicate statistical significances (P < .05). Biomarkers are ordered according to their permutation importances in the diagnostic model (Rank column). The second column indicates the mutation type of each SNV biomarker, with red for non-synonymous mutations, blue for synonymous mutations, and gray for SNVs located in the intergenic region. (b) Internal validation AUC matrix. Values on the diagonal refer to the average AUC values of fivefold cross-validation within each cohort. Off-diagonal values refer to the AUC values obtained by training the classifier on the cohort of the corresponding row and applying it to the cohort of the corresponding column. The LOCO row refers to the performances obtained by training the model using all but the cohort of the corresponding column and applying it to the cohort of the corresponding column. (c) The performances of the optimal SNV biomarker panel in three external validation datasets. (d) The barplot showing the comparison of the performances of SNV biomarkers in RF models for different microbiome-linked diseases: adenoma, CRC, CD, and UC. P values were from two-sided Wilcoxon rank-sum tests. (e) Patterns of the correlations of SNV biomarkers with disease status: distinct patterns observed for adenoma and other microbiome-linked diseases. Coefficient values calculated by MaAsLin2 and MMUPHin of each SNV biomarker are plotted by color gradients with orange for disease-enriched SNVs and blue for control-enriched SNVs.
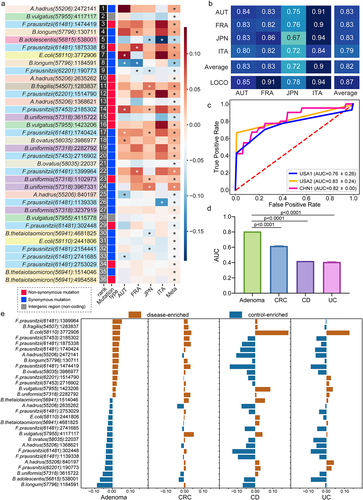
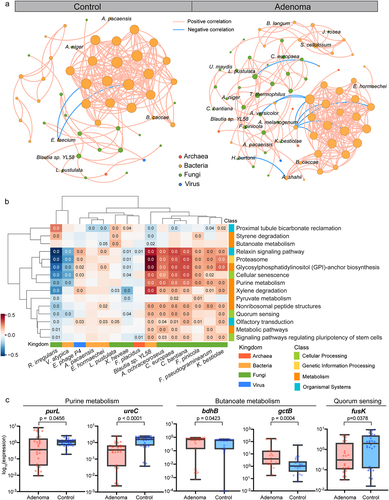
Figure 6. Cross-modality associations among the microbial signatures. (a) Multi-kingdom co-abundance networks in adenoma and control samples. Colors of nodes indicate different kingdoms: archaea (red), bacteria (yellow), fungi (green) and viruses (blue). Only correlations with P values <.05 and absolute correlation coefficients >.5 are included in the networks with peach lines for positive correlations and blue lines for negative correlations. (b) HAllA results showing associations between differential pathways and multi-kingdom species biomarkers. Significant associations between pathways and species were plotted (P < .05). Correlation coefficients are coded in color: red and blue indicate positive and negative correlations, respectively. Only P values <.05 are shown in the cells. (c) qPCR results showing the expression level of key genes in purine metabolism, butanoate metabolism, and quorum sensing. P values were from two-sided Wilcoxon rank-sum tests.
Supplemental Material
Download MS Excel (3.9 MB)Supplemental Material
Download MS Word (2.7 MB)Data availability statement
All processed data for this work are available at NODE with project ID OEP003766. Particularly, comprehensive multi-strain microbial SNV profiles are provided for future analysis. Raw data of our in-house metagenomic sequencing cohort are available from the Sequence Read Archive (SRA) with study ID: SRP308947. Other metagenomic sequencing data used in this manuscript are available from SRA with study IDs: ERP008729, ERP005534, DRA006684, DRA008156, SRP136711, SRP108915, SRP327788, and SRP129027.