
Figures & data
Figure 1. Construction and characterization of the magnetic chitin beads (MCB). (a) schematic diagram of the MCB synthesis. (b) bright field microscopic image of MCB in 1×PBS solution. Scale bar: 100 μm. (c) scanning electron microscope image of MCB. Scale bar: 100 μm. (d) MCB particle size distribution. (e) magnetic rack adsorption time of MCB encapsulating different concentrations of MNP. (f) hysteresis curves of MCB and MNP. (g) FTIR spectrums of MCB, MNP and pure chitin beads. (h) viable counts of V. cholerae co-cultured with MCB, MNP and chitin beads; glass beads were used as a control. (I) the viability of human cell lines HT29 and LS174 after 24h treatment with the indicated additives. Asterisks indicated statistically significant differences compared to the blank by t-test (**p < .01, ***p < .001, ns not significant).
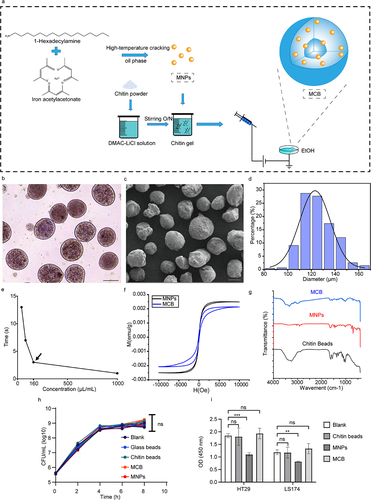
Figure 2. Characterization of the V. cholerae biofilm-coated magnetic chitin beads (vcMCB). (a) viable counts of V. cholerae on vcMCB. (b) confocal fluorescence microscopy showing fluorescent V. cholerae around the surface of vcMCB. Scale bar: 50 μm. (c) quantitative comparison of fluorescence of MCB and vcMCB. Significance by t-test is indicated (***p < .001). (d) SEM images of the surface of MCB (top) and vcMCB (bottom) at two magnifications, (left and right, as indicated). V. cholerae are seen adhering to the surface of vcMCB. (e) viable bacterial counts obtained with two methods for bacterial recovery from the intestine of adult mice dosed with vcMCB. Significant difference of magnetic bead recovery compared to PEG by t-test is indicated (**p < .01.) (f) quantification of live bacteria recovered from the mouse intestine, based on gene expression of bacterial 16S rRNA (total bacteria) and of V. cholerae-specific gyrB. β-actin was used as the internal reference gene. PBS buffer recovery method was used as a control. Statistical significance compared to PEG by t-test is indicated (*p < .05).
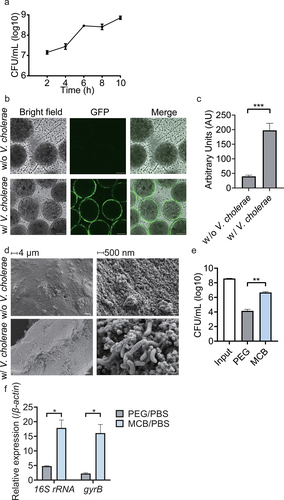
Figure 3. Comparative analysis of the V. cholerae transcriptome in adult mice with a complete intestinal microbiota. (a) schematic figure of samples collection. MCB were cultured in LB medium for 8 hours to form vcMCB. vcMCB were collected using a magnet and transferred to centrifugal tubes. The vcMCB was washed 3 times using 1× PBS buffer to remove planktonic cells. A portion of the obtained vcMCB was gavaged to mice. After incubation in vivo for 2 hours, mice were sacrificed to obtain the entire small intestine. The vcMCB in vivo samples were recovered using a magnet after longitudinal sectioning. The other portion of vcMCB was kept in 1×PBS buffer for 2 hours and subsequently recovered as vcMCB in vitro sample. (b) volcano plots showing fold-change differences in transcripts of vcMCB compared to in vitro vcMCB cultures. The negative log10 (adjusted p-value) is plotted against the log2FC on the x-axis. The colored genes had an FDR < 0.05. (c) expression heatmap of the top 20 up- and down-regulated differentially expressed genes (DEGs), with the annotation of gene function listed to the right of the heatmap.
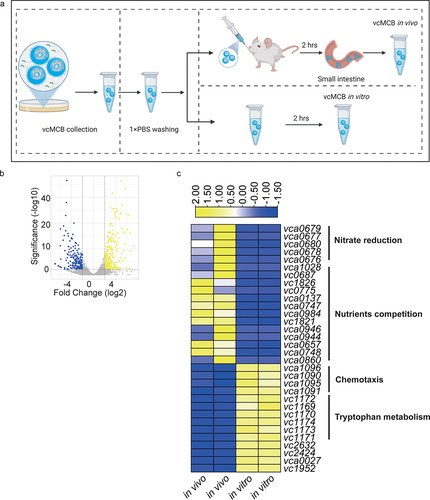
Figure 4. A microbiota recovery mouse model demonstrates functional genes in V. cholerae that respond to presence of gut microbiota. (a) infant CD1 mice were administrated with vcMCB containing a mixture of wild-type V. cholerae and the indicated overexpressing mutant at a ratio of 1:1. Intestinal samples were collected at 18 h post inoculation and after quantitation of bacterial loads the ratio of mutant to wild-type was calculated to give the competition index (CI). (b) the gut microbiota of four-week-old CD-1 mice was disrupted by streptomycin prior to V. cholerae dosage. Sm+/+ mice continued to receive streptomycin in their drinking water, while Sm+/- mice were allowed to restore their gut microbiota 14 h after dosage of the bacteria. All animals received a mixture of wild-type and the indicated overexpressing mutant. The CI of mutant/wild-type detected in fecal pellets 5 days post gavage is shown, normalized with the input ratio. Significance by t-test is indicated (ns, not significant, *p < .05, ****p < .0001).
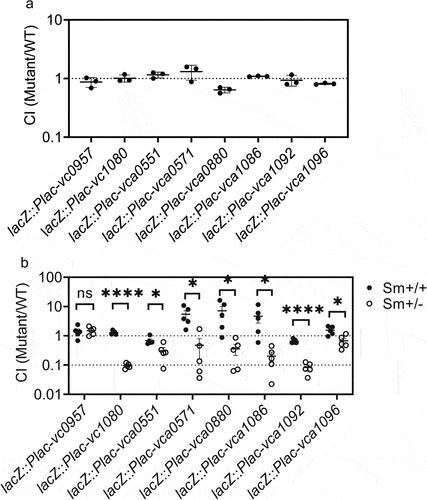
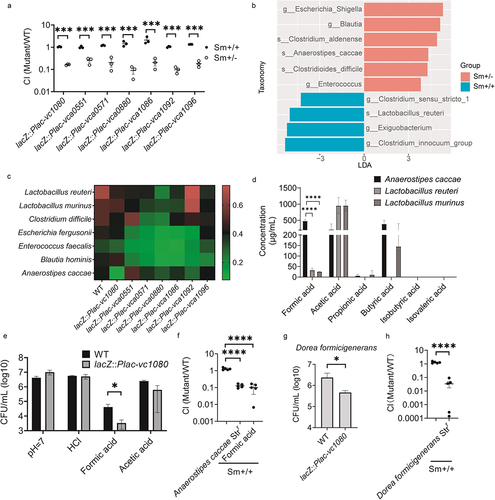
Figure 5. V. cholerae resists low pH and formic acid stress caused by A. caccae and D. formicigenerans through down-regulating vc1080. (a) competition index of mutants in fecal supernatants of Sm+/+ and Sm± mice. The fecal droppings were collected, homogenized and centrifuged. The resultant supernatants were filtered and added to a 1:1 mixture of WT and overexpression mutant. Significance by t-test is indicated (***p-value < .001). (b) LEfSe analysis of Sm+/+ mice vs. Sm+/- mice. LDA score processed by log. (c) viability of V. cholerae wild-type and overexpression mutants during co-culture with the intestinal bacteria under anaerobic conditions for 6h. The ratio indicated by the heat map color mean to indicate relative growth of V. cholerae strain co-cultured with gut bacteria compared to V. cholerae strain cultured alone. (d) SCFAs content in fermentation broth of A. caccae, L. murinus and L. reuteri. Significance by t-test is indicated (****p < .0001). (e) CFU of V. cholerae wild-type and mutant lacZ::Plac-vc1080 after 4 h of anaerobic growth in medium containing HCl, formic acid or acetic acid at a pH of 5.7. Control medium at pH 7 was included. Significance to wild-type by t-test is shown (*p-value < .05). (f) Sm+/+ mice were challenged by a mixture of wild-type and mutant lacZ::Plac-vc1080 while their drinking water contained 0.9 μg/mL formic acid and streptomycin for the whole experiment. A second group of Sm+/+ mice were inoculated with the same mixture but in combination with A. caccae Strr. The control of adult mice treated by Sm was included. CI values are based on fecal droppings collected after 5 days post gavage. Significance by t-test is indicated (****p < .0001). (g) viability of V. cholerae wild-type and overexpression mutants during co-culture with D. formicigenerans under anaerobic conditions for 6 h. Significance to wild-type by t-test is shown (*p-value < .05). (h) Sm+/+ mice were challenged by a mixture of wild-type and mutant lacZ::Plac-vc1080 in combination with D. formicigenerans Strr. The control of adult mice treated by Sm was included. CI values are based on fecal droppings collected after 5 days post gavage. Significance by t-test is indicated (**** p < .0001).
Supplemental Material
Download ()Data availability statement
All data relevant to the study are included in the article or uploaded as supplementary information. The datasets presented in this study can be found in the online repositories. The names of the repository/repositories and accession numbers (s) are PRJNA980451 and PRJNA980554 in the SRA database.