Figures & data
Table 1. Information on the studies included in the meta-analysis.
Figure 1. Characterization and distribution of three enterotypes in UC and HC subjects based on the gut microbiome. Ulcerative colitis, UC; healthy control, HC; ET-B, enterotype Bacteridaceae; enterotype ET-L, Lachnospiraceae; ET-C, enterotype Clostridiaceae. (a) The principal component analysis (PCA) diagram of the three enterotypes was drawn based on the fecal microbes at the family level. (b) The number of UC and HC subjects in each enterotype. The Chi-square test was used to count the significant differences in the number of people among the various enterotypes. (c) The relative abundance of the top 6 family taxon in each enterotype, we employed Tukey’s post-hoc test to identify significant differences among the enterotypes. Taxa that exhibited significant differences were annotated with English letters for clarity. (d) The relative abundance of the top 6 genus taxon in each enterotype, we employed Tukey’s post-hoc test to identify significant differences among the enterotypes. Taxa that exhibited significant differences were annotated with English letters for clarity.
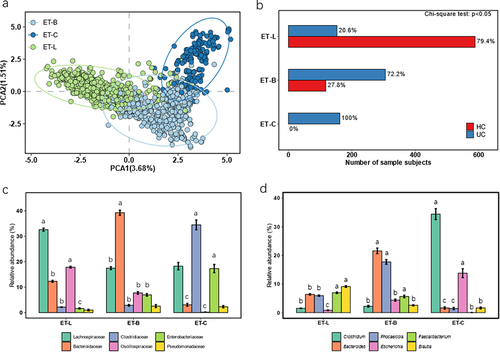
Figure 2. α-diversity by Shannon index and β-diversity by Bray–Curtis method. (a) α-diversity Shannon index in total participants. (b) α-diversity Shannon index in ET-B. (c) α-diversity Shannon index in ET-L. (d) β-diversity in total participants. (e) β-diversity in ET-B. (f) β-diversity in ET-L. Shannon index used the Wilcoxon test for significance analysis, and β-diversity used permutation multivariate analysis of variance (PERMANOVA) for significance. The numbers presented a significance level. Ulcerative colitis, UC; healthy control, HC; ET-B: Enterotype Bacteroidaceae cohort, ET-L: Enterotype Lachnospiraceae cohort; PCoA: Principal coordinate analysis.
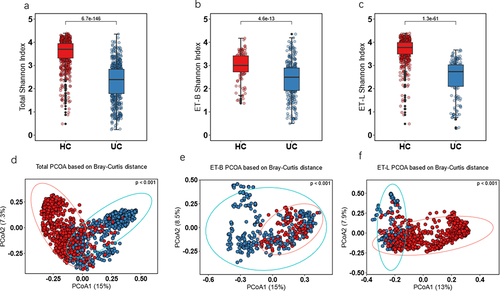
Figure 3. The SHapley additive exPlanations (SHAP) interpreter and species co-occurrence network (SCN) of the enterotype Lachnospiraceae (ET-L) queue deep neural network (DNN). (a) The SHAP interpreter was used to conduct the microbial-specific importance analysis in the DNN classifier. The middle line is biased to the left for the healthy controls (HC) classification and vice versa for the ulcerative colitis (UC) classification. The color of the scatter points represents the influence of the relative abundance of the feature on the classification. The variables used to train the DNN network were species of microorganisms significantly different in the UC and HC groups. (b) Box plot of the 20 taxons included in the SHAP beeswarm plot and the numbers indicated the significance level in the corresponding Wilcoxon rank sum test. (c) The SCN was constructed using important gut microbes in the DNN classifier. The SHAP importance was used to determine the top 20 bacteria, and the network diagram was drawn. It was determined whether it belonged to UC or HC according to the SHAP bee colony diagram and the mean value of UC and HC. All connections with a sparse correlation for compositional data (SparCC) correlation coefficient less than 0.1 were removed in the SCN. The red edges represent positive correlation, the blue represents negative correlation, the thickness represents the size of the absolute correlation coefficient, the yellow node represents the HC group, the purple represents the UC group, and the node size represents the relative abundance.
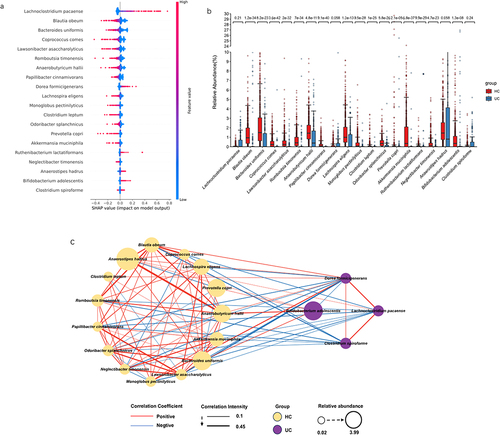
Figure 4. The SHapley additive exPlanations (SHAP) interpreter and species co-occurrence network (SCN) of the enterotype Bacteroides (ET-B) queue deep neural network (DNN). (a) The SHAP interpreter was used to conduct the microbial-specific importance analysis in the DNN classifier. The middle line is biased to the left for the healthy controls classification (HC) and vice versa for the ulcerative colitis (UC) classification. The color of the scatter points represents the influence of the relative abundance of the feature on the classification. The variables used to train the DNN network were species of microorganisms significantly different in the UC and HC groups. (b) Box plot of the 20 taxons included in the SHAP swarm plot and the numbers indicated the significance level in the corresponding Wilcoxon rank sum test. (c) The SCN was constructed using important gut microbes in the DNN classifier. The SHAP importance was used to determine the top 20 bacteria, and the network diagram was drawn. It was determined whether it belonged to UC or HC according to the SHAP bee colony diagram and the mean value of UC and HC. All connections with a sparse correlation for compositional data (SparCC) correlation coefficient less than 0.1 were removed in the SCN. The red edges represent positive correlation, the blue represents negative correlation, the thickness represents the size of the absolute correlation coefficient, the yellow node represents the HC group, the purple represents the UC group, and the node size represents the relative abundance. (d) Linear discriminant analysis (LDA) scores of the HC and UC groups in LDA effect size (LEfSe). (e) Differential analysis of PICRUSt2-predicted gut microbiome function between UC and HC in the ET-B cohort was performed using LEfSe. The correlation analysis between the functions that LEfSe showed significant differences and the common pro-inflammatory functions and the important bacteria of HC and UC in the SHAP analysis was drawn into a heatmap.
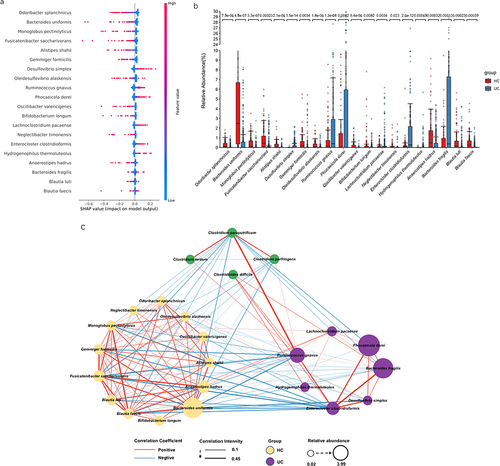
Figure 4. (Continued).
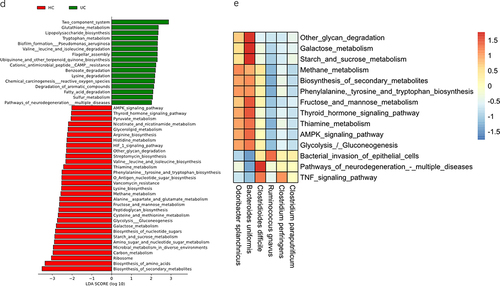
Table 2. The relative abundance of ET-B group UC bacteria and HC bacteria in each enterotype.
Figure 5. Gut microbiota composition of volunteer subjects and results of in vitro experiments. (a) The relative abundance of the top 5 intestinal flora at the family level of 5 subjects. Subjects with a higher abundance of Bacteroidaceae and lower numbers of Lachnospiraceae and ruminococcaceae were classified as enterotype bacteridaceae (ET-B). Subjects with a higher abundance of Lachnospiraceae and ruminococcaceae were classified as enterotype Lachnospiraceae (ET-L). (b) Enumeration of C. difficile in ET-B and ET-L feces cultured in vitro. ETL-CD: ET-L enterotype feces co-cultured with C. difficile, ETL-Con: ET-L enterotype feces co-cultured with C. difficile, ETB-CD: ET-B enterotype feces co-cultured with C. difficile, ETB-Con: ET-B enterotype feces cultured alone. Statistical differences in Tukey’s test are expressed in letters. Different letters indicate significant differences between groups, and the same letters indicate no significant differences.
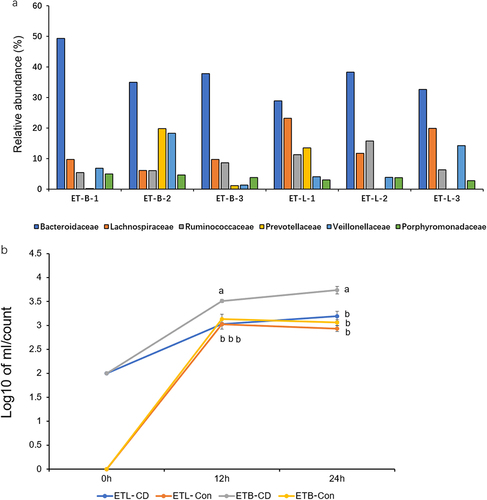
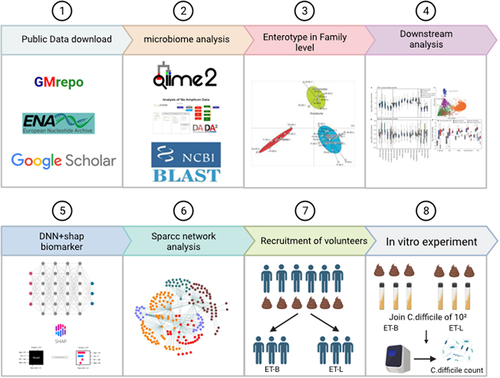
Figure 6. Workflow. Enterotype classification adopted by Arumugam et al.Citation9 was used. ET-B: enterotype bacteridaceae, ET-L: enterotype Lachnospiraceae, ET-C: enterotype Clostridiaceae. Deep neural network (DNN). SHapley additive exPlanations (shap).