
Figures & data
Figure 1. HFD-fed fat-1 mice are protected against colonic mucus layer alteration.
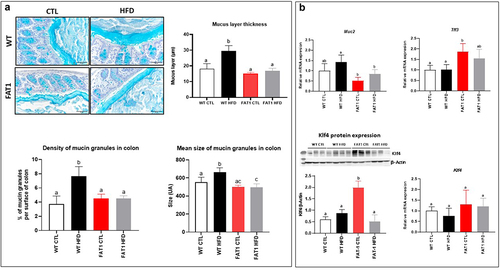
Figure 2. Omega-3 tissue enrichment protects fat-1 mice against HFD-induced structure changes of the colonic mucus layer.
Figure 3. Markers of the colonic endoplasmic reticulum stress are alleviated in HFD-fed fat-1 mice.
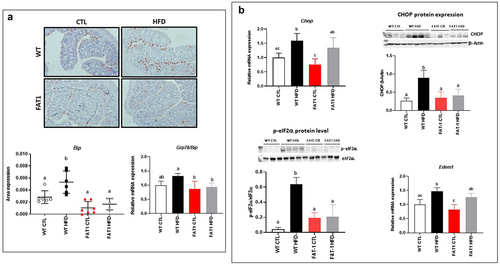
Figure 4. Impact of high fat feeding and omega-3 fatty acid tissue enrichment on colonic autophagy.
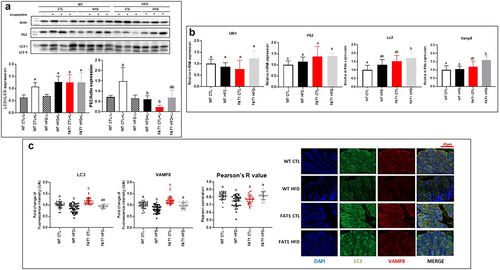
Figure 5. Transplantation of fat-1 microbiome decreases weight gain, enhances metabolic parameters and alleviates intestinal alteration in mice fed a HFD.
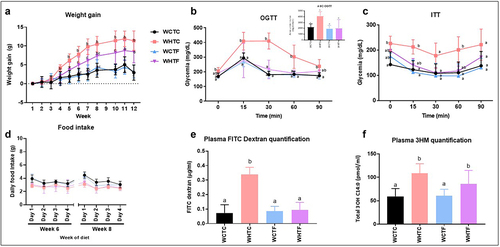
Figure 6. Transplantation of the fat-1 microbiome prevents the increase of the thickness of the colonic mucus layer in mice fed the HF diet.
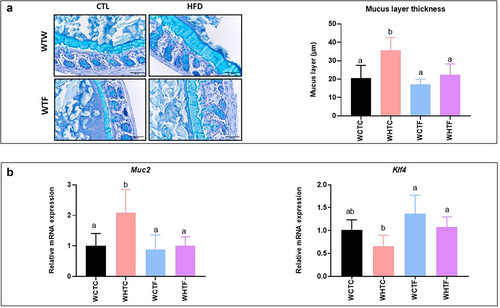
Figure 7. Transplanting fat-1 microbiome protects HFD-fed WT mice against colonic endoplasmic reticulum stress.
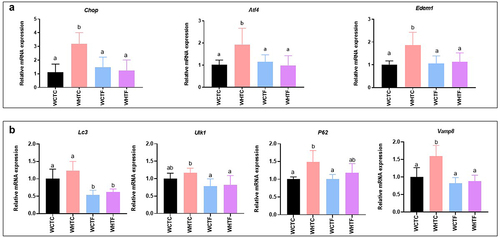
Figure 8. Impact of HFD on microbiota analysis in WT mice transplanted with WT or fat-1 microbiome.
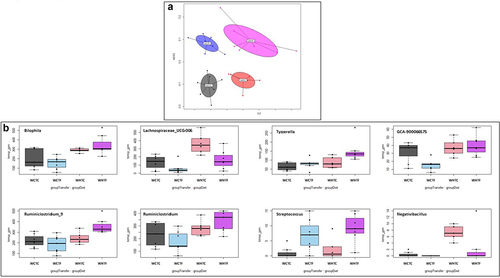
Figure 9. Impact of HFD on metabolites in the cecum of WT mice transplanted with WT or fat-1 microbiome.
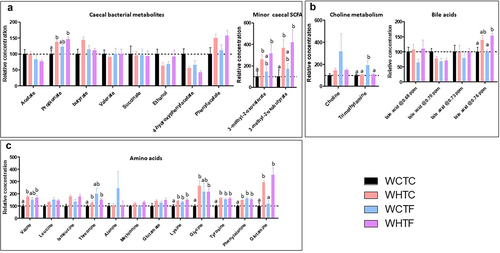
Table 1. Identification of metabolites in cecal content NMR spectra.
Supplemental Material
Download Zip (526.2 KB)Data availability statement
The Illumina MiSeq cecal microbiota analysis sequences were submitted to the Short-Read Archive with accession number PRJNA946706.