
Figures & data
Figure 1. Overview of clinical study design. Patient info was collected at birth, 3 months of infant age, and 12 months of infant age. 16S sequencing was performed on 42 stool samples collected at 3 months and 44 stool samples collected at 12 months. Metatranscriptomics sequencing was performed on 30 of the stool samples collected at 12 months. 28 samples were included for 16S analysis at 3 months. 30 samples were included for 16S and metatranscriptomics analysis at 12 months. See for demographic information.
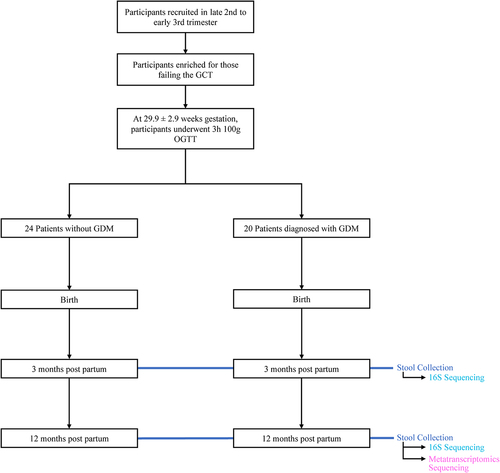
Table 1. Study demographic table.
Figure 2. Diversity analyses of 16S data by mode of delivery. (ab) Shannon Alpha diversity analysis. Analysis of Variance (ANOVA) was used to test for statistical significance. (cd) Bray-curtis principal coordinate analysis beta diversity analysis. Ellipses represent 95% confidence interval for a multivariate normal distribution. n = 19, Cesarean-section; n = 39, Vaginal. n = 28, 3 months; n = 30, 12 months. *p ≤ .05, **p ≤ .01, ***p ≤ .001.
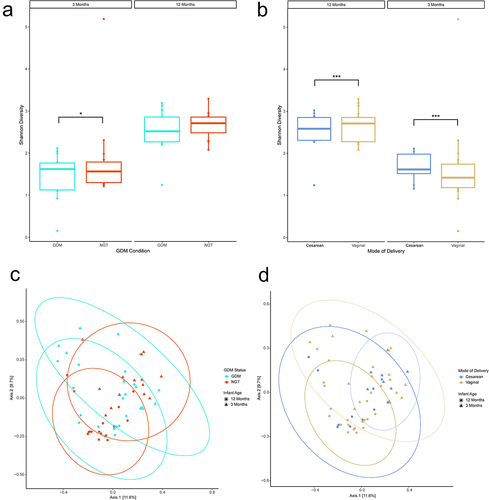
Figure 3. Stacked bar chart illustrating the relative abundance of families in the 16S samples compared to the relative read abundance expressed by each family in metatranscriptomics (MTX) samples. Samples are stratified by gestational diabetes (GDM) condition of the mother. Sorted by decreasing relative abundance of Bacteroidetes phylum in MTX samples. Limited to the top 12 most abundant families. Colours of each family correspond to color of the parent phyla in Supplemental Figure 2 (e.g., Lachnospiraceae is color coded to the Firmicutes phylum). n = 30.
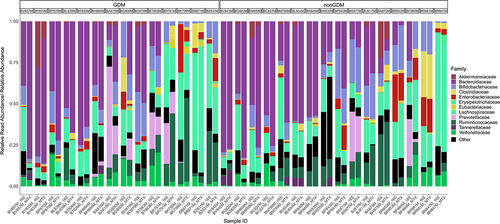
Figure 4. Volcano plot depicting differentially expressed gene (DEG) results for mode of delivery and mode of delivery-controlled factors. Log2 fold change and -log10(p value) are both from results of poscounts DESeq2. Colour of dot corresponds to taxonomic annotation. Grey points are non-DEGs. (a) nonGDM vs GDM. (b) Vaginal birth vs cesarean section birth. (c) Male vs female. (d) Exclusive breastfeeding vs. partial breastfeeding. Upregulation and downregulation are relative to the labels. n = 21563 genes.
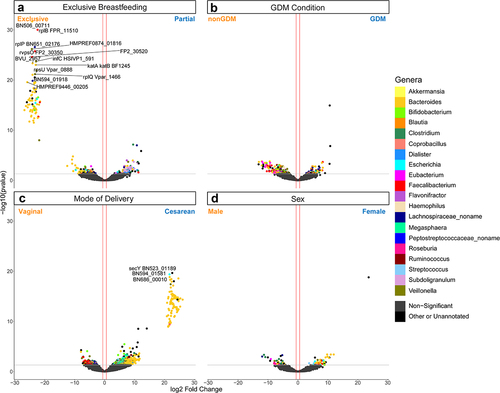
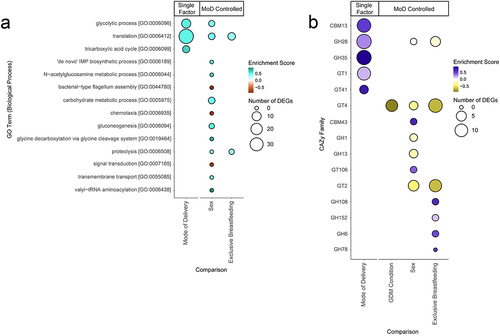
Figure 5. Bubble charts detailing each Gene Ontology (GO) biological process term and carbohydrate-active enzyme (CAZy) family that was significantly enriched in our differential expression results. Enriched terms were identified using the fgsea R package.Citation35 Size of bubble indicates the number of DEGs from a given functional category associated with the factor. Enrichment score indicates degree and direction of enrichment for a given term. GO terms and CAZy families are sorted by adjusted p-value. Mode of delivery (MoD) controlled terms are indicated. (a) Bubble chart of GO term enrichment. MoD-controlled GDM condition is omitted as there were no significant terms. (b) Bubble chart of CAZy enzymes. CBM = Carbohydrate-Binding Modules, GH = Glycoside Hydrolases, GT = GlycosylTransferases.
Supplemental Material
Download Zip (3.5 MB)Data availability statement
Sequence data is deposited at the NCBI under BioProject repository identifier PRJNA1013505.