
Figures & data
Figure 1. Protocol and systemic parameters for SPF mice.
(a) Schematic view of the protocol. All animals were 3 to 4 weeks old at the beginning of the protocol and received exactly the same diet except for iron content. Specific pathogen-free (SPF) female C3H/HeN mice were fed a diet containing 65 mg/kg or <6 mg/kg iron for 15 (D15), 30 (D30), 45 (D45), or 60 days (D60). The number of mice used for each time point is indicated in parentheses (n). Mice were euthanized to evaluate systemic, tissue, and cellular parameters. (b) Effects of an iron-deficient diet on the weight and plasma or blood parameters of SPF mice. The weight of the mice, plasma transferrin saturation coefficient, and ferritin (µg/L), hepcidin (ng/mL), and hemoglobin (g/dL) levels were measured on D15 (n = 4), D30 (n = 4), D45 (n = 4), and D60 (n = 6) for both the iron− and iron+ groups. p values < .05 (*), < .005 (**), and < .0005 (***) indicate the significance of the differences between groups with and without iron by two-way ANOVA with Sidak’s multiple comparison test.
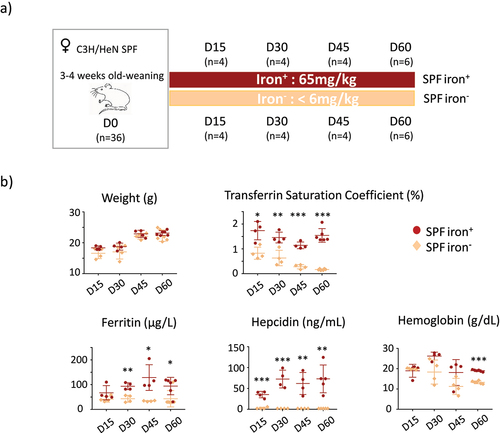
Figure 2. Effects of iron deprivation on tissue parameters of SPF mice.
Protein levels were assessed by western-blot analysis on D15 (n = 4), D30 (n = 4), D45 (n = 4), and D60 (n = 6) for the duodenum, liver, and lungs of SPF mice in the iron+ and iron− groups. A representative western blot is shown for each condition.  -actin was used as a loading control. a) Western blots (representative membranes) and quantification (graphs) of ferritin in total protein extracts. All values were normalized relative to the mean ferritin signal at D15 for mice fed the iron+ diet. b) Western blots (representative membranes) and quantification of Dmt1 in membrane protein extracts. As described by Yanatori et al., Citation45DMT1 appears on the western blot as 90–116 kDa smear. The arrow indicates the upper band used for quantification of DMT1 in lung. All values were normalized relative to the mean of Dmt1 at D15 for mice fed the iron+ diet. P values < .05 (*), < .005 (**), <.00001 (****) indicate the statistical difference between the iron− and iron+ groups for each time point by two-way ANOVA with Sidak’s multiple comparison test.
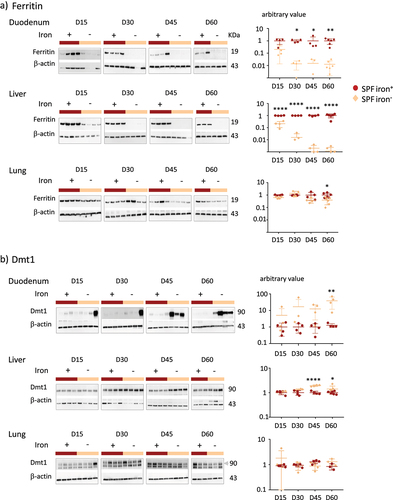
Figure 3. Protocol and parameters for GF mice.
a) Schematic view of the protocol. Female germ-free (GF) C3H/HeN mice were fed a diet containing 65 mg/kg iron or <6 mg/kg for 15 (D15) or 30 days (D30) because a longer period of iron privation led to weight loss (Supplemental data 4). On day 30, GF mice were inoculated with a mix of four primo-colonizing bacteria (GF+primo) by oral gavage. The primo-colonizing bacteria consisted of E. faecalis (strain X98), B. thetaiotaomicron (strain L55), E. coli (strain CEC15), and B. longum (strain L74). Mice with the primo-mix were euthanized four days (D34) after inoculation. Mice were euthanized to evaluate the systemic, tissue, and cellular parameters. The number of mice used for each time point are indicated in parentheses (n). b) Effects of an iron-poor diet on the weight and plasma parameters of GF and GF+primo mice. The weight (g), transferrin saturation coefficient (%), and ferritin (µg/L), hepcidin (ng/mL), and hemoglobin (g/dL) levels were determined on D15 (n = 3 iron+, and n = 3, iron−), D30 (n = 3, iron+ and n = 3, iron−), and D34 (n = 2, iron+ and n = 3, iron−) after the beginning of the intervention. P values < .05 (*), < .005 (**), and < .0005 (***) indicate the statistical difference between the groups fed diets with and without iron by two-way ANOVA with Sidak’s multiple comparison test (the D34 group was excluded because n = 2). c) Compilation of the parameters obtained for GF and SPF mice at D15 and D30 for the iron+ and iron− conditions. The line indicates the threshold of detection of serum hepcidin (2 ng/mL). P values < .05 (*), < .005 (**), and < .0005 (***) indicate the statistical difference between the GF and SPF groups for each condition by two-way ANOVA with Sidak’s multiple comparison test.
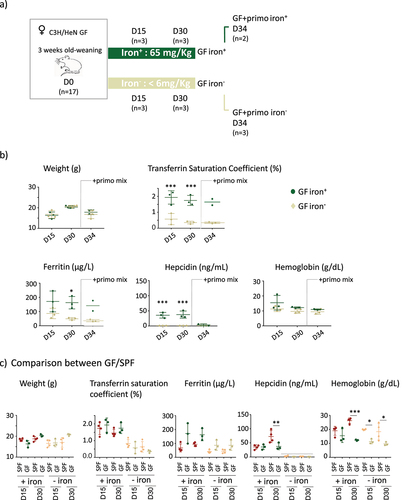
Figure 4. Effect of iron privation on ferritin in GF and SPF mice.
a) The amount of ferritin in the tissues of GF and GF+primo mice was studied by western blotting on D15 (n = 3), D30 (n = 3), and D34 (n = 2) for the iron+ group and on D15 (n = 3), D30 (n = 3), and D34 (n = 3) for the iron− group. Western blots and quantification of ferritin in total protein extracts from the duodenum, liver, and lungs of GF and GF+primo mice. A representative western blot is shown for each condition. -actin was used as a loading control. All values are normalized relative to the mean of ferritin on D15 for mice fed the iron+ diet. P values < .05 (*) and < .0005 (***) indicate the statistical difference between the iron− and iron+ groups for each time point by two-way ANOVA with Sidak’s multiple comparison test. b) Duodenum and liver proteins from GF and SPF were loaded on the same gel to allow the comparison of ferritin between groups over time (n = 3 for GF and n = 4 for all SPF groups). All values are normalized relative to the mean of ferritin on D15 for SPF mice fed the iron+ diet (upper panel) and D15 for SPF mice fed the with iron− diet (lower panel). P values < .05 (*) and < .0001 (****) indicate the statistical difference between GF and SPF mice for each time point by 2 two-way ANOVA with Sidak’s multiple comparison test.
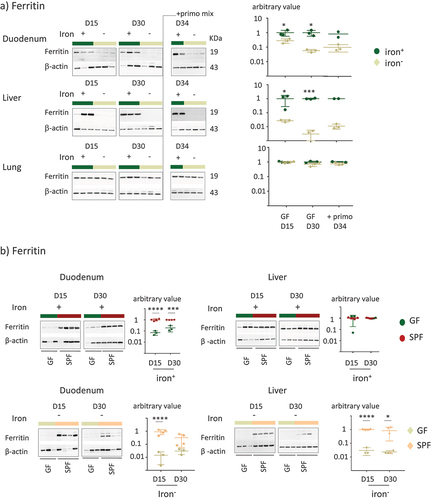
Figure 5. Effect of iron privation and the microbiota on Dmt1 expression and Effect of B. thetaiotaomicron supernatant on Hif-2α protein.
a) Western blots and quantification of Dmt1 in duodenum membrane protein extracts on D15 (n = 2), D30 (n = 3), and D34 (n = 2) for mice in the iron+ group and D15 (n = 2), D30 (n = 3), and D34 (n = 3) for mice in the iron− group. A representative western blot is shown for each condition. -actin was used as a loading control. b) Western blot and quantification of Dmt1 in duodenum membrane protein extracts from SPF D30 (n = 2), GF+primo D34 (n = 3), and GF D30 (n = 3) mice fed the iron− diet. All values are normalized relative to the mean of Dmt1 on D30 for GF mice fed the iron− diet. p values < .05 (*) indicate the statistical difference between the GF and GF+primo groups by the nonparametric Mann–Whitney T-test. c) Effect of B. thetaiotaomicron supernatants on Hif-2α protein levels in HT29 cells. HT29 cells were incubated 6 h in the absence (-) or presence (+) of oxygen and then co-incubated with LyBhi or LyBhi mixed with an equal amount of a supernatant of an over-night culture of B. thetaiotaomicron. A representative western blot of HIF-2α and β-actin proteins is shown.
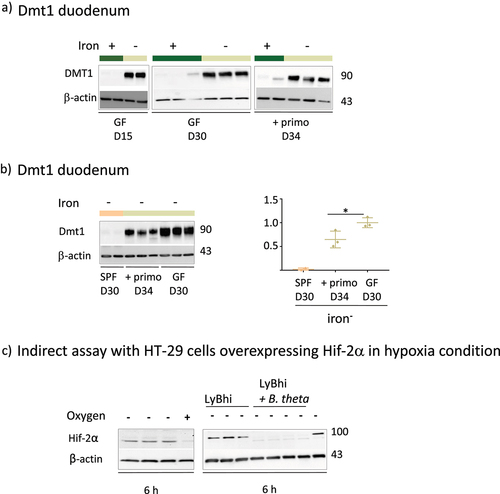
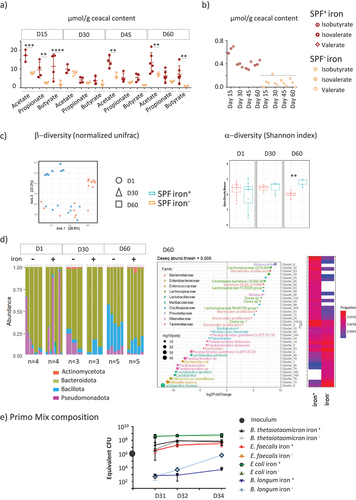
Figure 6. Reciprocal effects of iron deprivation on microbiota.
a) Acetate, proprionate, butyrate, and b) minor short chain fatty acids were measured in the cecum of SPF mice at D15, D30, D45, and D60 from the iron− and iron+ groups. The line indicates the threshold of detection (under 0.4 µmol/g). p values < .005 (**), < .0005 (***), and < .0001 (****) indicate the statistical difference between groups fed diets with and without iron by two-way ANOVA with Sidak’s multiple comparison test. c) diversity index of the microbiota in SPF mice receiving the two diets for 1, 30, and 60 days.Left panel: -diversity by the normalized UNIFRAC index. Right panel: box plot showing -diversity using the Shannon index. p values < .005 (**) indicate the statistical difference between groups fed diets with and without iron by two-way ANOVA with Sidak’s multiple comparison test. d) Microbiota composition based on 16 S sequences from fecal samples of mice from the iron− and iron+ groups at different time points. Left panel: phylum level. Right panel: different operational taxonomic units expressed on D60 as a function of diet. e) At D30, GF mice were orally inoculated with a mixture () containing 106 CFU of Enterococcus faecalis (strain X98), Bacteroides thetaiotaomicron (strain L55), Escherichia coli (strain CEC15), and Bifidobacterium longum (strain L74). Each strain was equivalently represented in the inoculum. Quantification by real-time PCR of each primo-colonizing strain one day (D31), two days (D32), and four days (D34) after inoculation for the iron+ (n = 2) and iron− (n = 2) groups.
Supplemental material