Figures & data
Figure 1. (a) Graphical abstract of the in vitro screening process. (b) Heatmap showing inhibited species based on spot assay of 48 common gut species. The heatmap is colored according to the halo-size of the in vitro assay. White tiles indicate NA values. The phylogenetic relationship of target strains and bacteriocin sequences are displayed to the right of the plot and on top of the plot, respectively. (*) indicates that this species has been implemented in diseases or disorders and not before has been characterized to be inhibited by this/these bacteriocins. (c) a multiple alignment for the functional bacteriocin sequences using Cobalt multiple alignment tool. Red AA indicates highly conserved regions. (d) Structures of the predicted bacteriocin sequences using alpha-fold,Citation43 only the pro-peptide was used for the analysis. On the structure model, confidence is colored according to: Dark blue: Very high (pLDDT > 90) Light blue: Confident (90 > pLDDT > 70), Yellow: Low (70 > pLDDT > 50), Red: Very low (pLDDT < 50). The four structures shown are representative structures based on the sequence alignment. The lower helix on the three structures constitutes the leader sequence (except for Bacteroidetocin a (#22)).
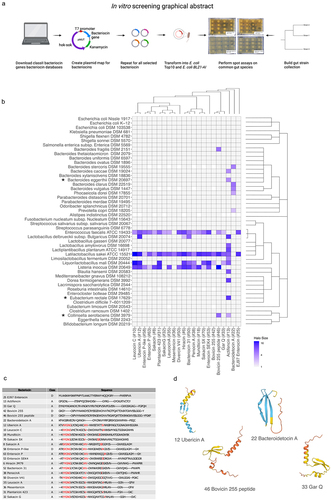
Figure 2. (a) Graphical abstract of the ex vivo experimental setup. (b) Relative abundance plot for strains isolated on mGAM mixed water (control) or the bacteriocins 0, 12, 13 and 22, mGAM-vancomycin-kanamycin mixed water (control) and with the bacteriocins 0 and 22, and MRS mixed with water (control) or the bacteriocins 0, 12, and 13. (c) Heatmap showing the reads assigned from colonies isolated from mGAM mixed with water (control) or the bacteriocins 0, 12, 13 and 22, having at least 20% abundance in 5 samples. Notably the abundance of Lactobacillus is almost zero on the mGAM media mixed with supernatant from Actifencin (#13) (purple square), whereas the abundance of Bacteroides is clearly enriched. Bacteroides species on the other hand is depleted on the mGAM media mixed with supernatant from Bacteroidetocin a (#22) (green square). (d) Significant features found on the selection plates: mGAM + actifencin (#13), mGAM + bacteroidetocin a (#22), and mGAM-vancomycin+kanamycin + bacteroidetocin a (#22). Significance is based on LogFC compared to control plates. (Significance level, padj < 0.05). Negative values indicate less abundance on the bacteriocin plates compared to control. (All tests were made with DAtest and EdgeR - Quasi likelihood test). (e) Beta-diversity plot showing that some samples group together based on media and bacteriocin selection criteria.
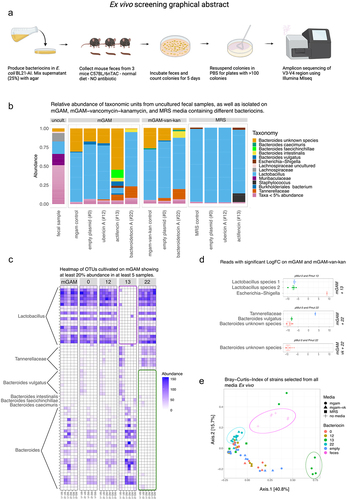
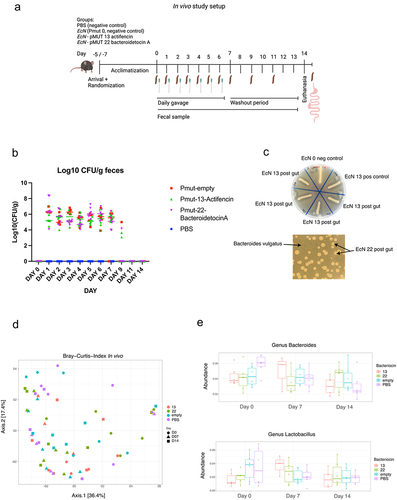
Figure 3. (a) graphical representation of the in vivo study showing the gavage and fecal collection. (b) Log10 (Cfu/g feces) of surviving EcN in the feces after 24 h post gavage. (c) Overlay spot assay of EcN isolated from fecal samples of mice orally dosed with EcN_pmut13_actifencin and EcN_pMUT22_bacteroidetocinA. Inhibition zones can be visualized around the growing cultures. EcN 0 refers to the strain producing no bacteriocin, EcN 13 refers to the lab strain, EcN 13.A-d refers to individual colonies re-streaked on LB plates from the fecal samples. Indicator strain used: L. mali DSM 20,444. Bacteroidetocin a (#22) was assessed directly from the plating of feces on selection plates using top agar containing B. vulgatus. (d) Beta-diversity plots showing no clear patterns of clustering between the groups, as opposed to what was found in the ex vivo study. (e) Relative abundance plots shown for the genus: Lactobacillus and Bacteroides for the study days: 0, 7 and 14. No significant difference was to be found between the different days for these two genera between the groups.