
Figures & data
Figure 1. Gut microbiota of mice fed with the chow diet and purified diet determined by 16s rRNA gene sequencing. (a) Experimental design. (b) Indices of alpha diversity including Chao, Ace, Shannon and Simpson indices. (c) Principle Co-ordinates Analysis (PCoA, unweighted Unifrac) of gut microbiota. (d) Cladogram of LEfSe of gut microbiota. (e) Relative abundance of Desulfovibrio. n = 10 mice per group. Data are represented as the mean ± SEM, two-tailed Student t-test or Mann–Whitney test, *p < 0.05, **p < 0.01.
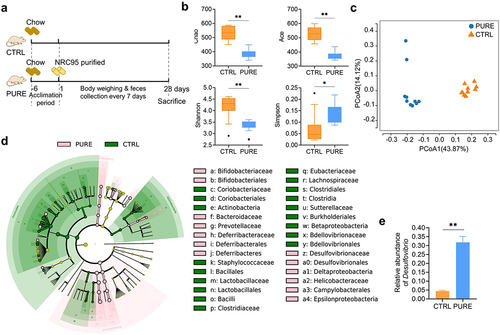
Figure 2. Cecal and fecal BA profile of mice fed with the chow diet and purified diet. (a) Concentrations of unconjugated primary BAs, conjugated primary BAs, unconjugated secondary BAs, conjugated secondary BAs and total BAs in mouse ceca. (b) Percentage composition of BAs in mouse ceca. Mean values of each BA type were used to draw the pie charts. (c) Concentrations of unconjugated primary BAs, conjugated primary BAs, unconjugated secondary BAs, conjugated secondary BAs and total BAs in mouse feces. (d) Fecal/cecal ratios of unconjugated primary BAs, conjugated primary BAs, unconjugated secondary BAs, conjugated secondary BAs and total BAs. n = 3 mice per group. Data are represented as the mean ± SEM, two-tailed Student t-test or Mann–Whitney test, *p < 0.05, **p < 0.01.
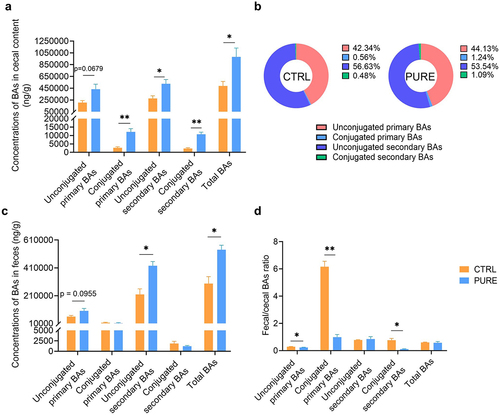
Figure 3. Hepatic and colonic histology and gene expressions in mice fed with the chow diet and purified diet. (a) H&E staining of liver sections. (b) IHC staining of F4/80 and quantification of highly positive areas of liver sections. (c) IHC staining of Ly6G and quantification of positive areas of liver sections. Black arrows point to the accumulation of immune cells. Scale bar: 100 μm. (d) KEGG enrichment analysis. Gene expression levels with absolute value of log2(FC) > 0.58, Qvalue (FDR corrected p value) < 0.05 in DESeq2 analysis were subject to hypergeometric test, pathway Qvalue (FDR corrected p value) < 0.1 were shown in the graph. (e) GSEA plot of glutathione metabolism. The leading edge gene subset (red lines) is on the right of the peak when ES < 0, representing up-regulation of this pathway in the CTRL group. (f) Expression levels of genes encoded Glutathione S-transferase (GST) family alpha (Gsta), mu (Gstm), pi (Gstp) and theta (Gstt). (g) GSEA plot of bile secretion. The leading edge gene subset (red lines) is on the right of the peak when ES < 0, representing up-regulation of this pathway in the CTRL group. (h) Gene expression levels of hepatic Cyp7a1, Cyp8b1 and Nr1h4 determined by RNA-seq. TPM: transcripts per million. (i) Relative mRNA expression of Zo1 and Ocln in the colon determined by qRT-PCR. (j-k) IHC staining of ZO1 and OCLN and quantification of mean optical density (OD) of the signal. Scale bar: 100 μm. n = 3–5 mice per group. Data are represented as mean ± SEM, two-tailed Student t-test or Mann–Whitney test, *p < 0.05, **p < 0.01.
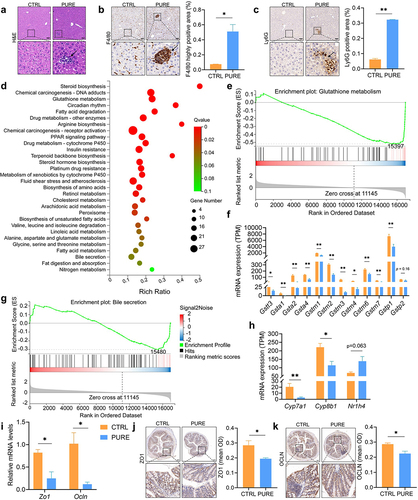
Figure 4. Hepatic and colonic histology and gene expressions in mice fed with the chow diet with or without DSV administration. (a) Experimental design. (b) H&E staining of liver sections. (c) IHC staining of F4/80 and quantification of highly positive areas of liver sections. (d) IHC staining of Ly6G and quantification of positive areas of liver sections. Scale bar: 100 μm. Black arrows point to the accumulation of immune cells in (b-d). Black triangle indicated hepatocellular necrosis in (b). (e) Relative mRNA levels of hepatic Sod1, Sod2, Gsta2, Gstm1, Gstm2 and Gstp1. (f) Hepatic SOD activity. (g) Hepatic GST activity. (h) Concentrations of hepatic total glutathione, reduced glutathione (GSH) and oxidized glutathione (GSSG). (i) Relative mRNA levels of hepatic Cse, Mpst and Cbs. (j) Relative mRNA levels of hepatic Aoah. (k) Relative mRNA levels of hepatic Cyp7a1, Cyp8b1 and Nr1h4. (l) Relative mRNA levels of colonic Zo1 and Ocln. (m-n) IHC staining of ZO1 and OCLN and quantification of mean OD of the signal. Scale bar: 100 μm. n = 3–5 mice per group. Data are represented as mean ± SEM, two-tailed Student t-test or Mann–Whitney test, *p < 0.05, **p < 0.01.
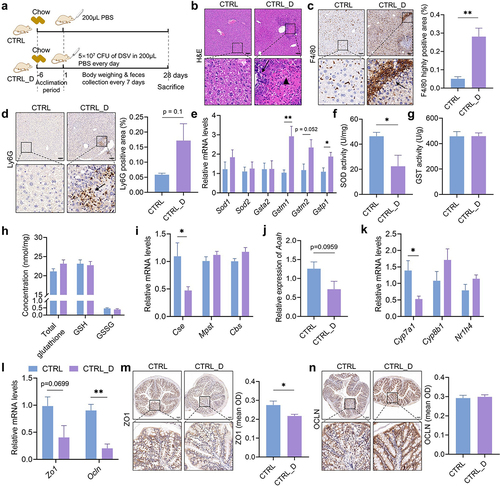
Figure 5. Gut microbiota and gut BA profile in mice fed with the chow diet with or without DSV administration. Gut microbiota was determined by shortgun metagenomic sequencing. (a) Alpha diversity. (b) PCoA (Bray-Curtis). (c) Cladogram of LEfSe. (d) Relative abundance of Desulfovibrio. (e) Concentrations of unconjugated primary BAs, conjugated primary BAs, unconjugated secondary BAs, conjugated secondary BAs and total BAs in mouse ceca. (f) Percentage composition of BAs in mouse ceca. Mean values of each BA type were used to draw the pie charts. (g) Concentrations of unconjugated primary BAs, conjugated primary BAs, unconjugated secondary BAs, conjugated secondary BAs and total BAs in mouse feces. (h) Fecal/cecal ratios of unconjugated primary BAs, conjugated primary BAs, unconjugated secondary BAs, conjugated secondary BAs and total BAs. n = 5 mice per group in (a-d); n = 3–5 mice per group in (e-h). Data are represented as the mean ± SEM, two-tailed Student t-test or Mann–Whitney test, *p < 0.05, **p < 0.01.
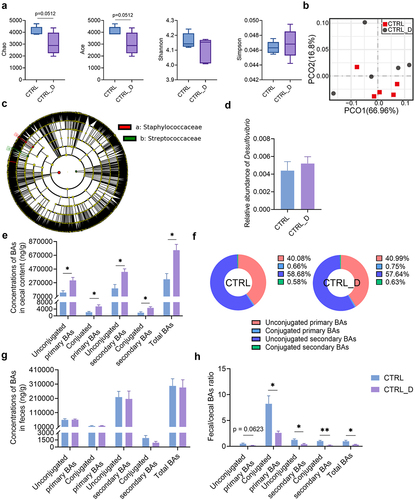
Figure 6. Hepatic and colonic histology and gene expressions in mice fed with the purified diet and SAAL diet with or without DSV administration. (a) Experimental design. (b) H&E staining of liver sections. (c–d) F4/80 and Ly6G IHC staining, respectively. Scale bar: 100 μm. Black arrows point to the accumulation of immune cells in (b–d). Black triangle indicated hepatocellular necrosis in (b). (e) Quantification of highly positive areas in IHC staining of F4/80 and positive areas in IHC staining of Ly6G. (f) Relative mRNA levels of hepatic Sod1, Sod2, Gsta2, Gstm1, Gstm2 and Gstp1. (g) Hepatic SOD activity. (h) Hepatic GST activity. (i) Concentrations of hepatic total glutathione, GSH and GSSG. (j) GSH/GSSG ratio. (k) Relative mRNA levels of hepatic Cse, Mpst and Cbs. (l) Relative mRNA levels of hepatic Aoah. (m) Relative mRNA levels of hepatic Cyp7a1, Cyp8b1 and Nr1h4. (n) Relative mRNA levels of colonic Zo1 and Ocln. (o) IHC staining of ZO1 and quantification of mean OD of the signal. (p) IHC staining of OCLN and quantification of mean OD of the signal. Scale bar: 100 μm. n = 3–5 mice per group. Data are represented as mean ± SEM, one-way ANOVA or Kruskal–Wallis test with FDR post hoc test (Two-stage step-up method of Benjamini, Krieger and Yekutieli), *p < 0.05, **p < 0.01.
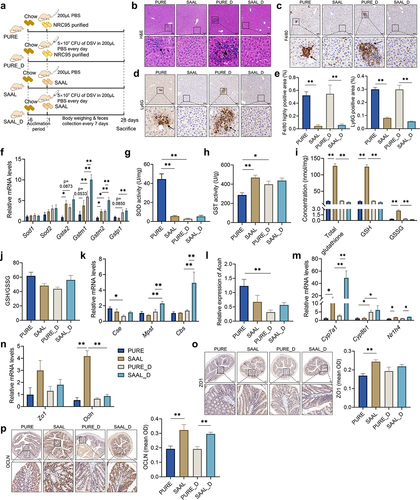
Figure 7. Gut microbiota of mice fed with the purified diet and SAAL diet with or without DSV administration. (a) Alpha diversity. (b) PCoA (Bray-Curtis). (c) Cladogram of LEfSe. (d) Relative abundance of Desulfovibrio. n = 5 mice per group. Data are represented as the mean ± SEM, one-way ANOVA or Kruskal–Wallis test with FDR post hoc test (Two-stage step-up method of Benjamini, Krieger and Yekutieli),*p < 0.05.
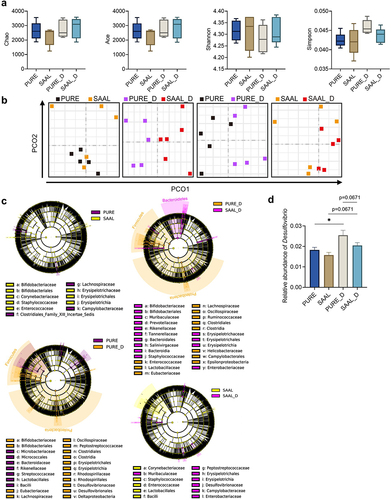
Figure 8. Cecal and fecal BA profile of mice fed with purified diet and SAAL diet with or without DSV administration. (a) Concentrations of unconjugated primary BAs, conjugated primary BAs, unconjugated secondary BAs, conjugated secondary BAs and total BAs in mouse ceca. (b) Percentage composition of BAs in mouse ceca. Mean values of each BA type were used to draw the pie charts. (c) Concentrations of unconjugated primary BAs, conjugated primary BAs, unconjugated secondary BAs, conjugated secondary BAs and total BAs in mouse feces. (d) Fecal/cecal ratios of unconjugated primary BAs, conjugated primary BAs, unconjugated secondary BAs, conjugated secondary BAs and total BAs. n = 3–6 mice per group. Data are represented as the mean ± SEM, one-way ANOVA or Kruskal–Wallis test with FDR post hoc test (Two-stage step-up method of Benjamini, Krieger and Yekutieli), *p < 0.05, **p < 0.01.
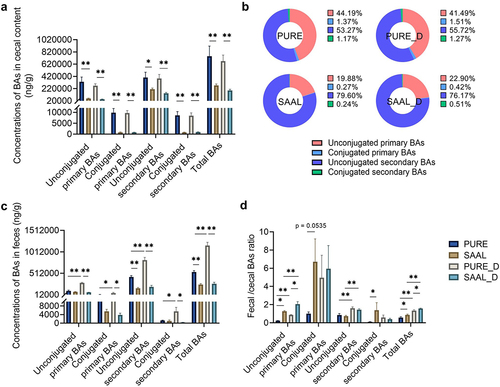
Figure 9. Alterations of microbial composition and BA profile in ex vivo fermentation culture of human fecal bacteria with four conjugated primary BAs. (a) Experimental design. (b) Relative abundance of differential bacterial phyla (p < 0.1). (c) Relative abundance of differential bacterial classes (p < 0.1). (d) Relative abundance of differential bacterial orders (p < 0.1). (e) Relative abundance of differential bacterial families (p < 0.1). (f) Relative abundance of differential bacterial genera (p < 0.1). (g) Log of the concentration of unconjugated primary and unconjugated secondary BAs in the B and DB group. n = 4 human fecal samples per group, one-tailed paired t-test or Wilcoxon matched-pairs signed rank test, *p < 0.05, **p < 0.01. (h) Concentration of unconjugated primary and secondary BAs in the KB and M group (concentration instead of log of concentration was used for the y-axis because zero value was present). Data are represented as the mean ± SEM, two-tailed Student t-test.
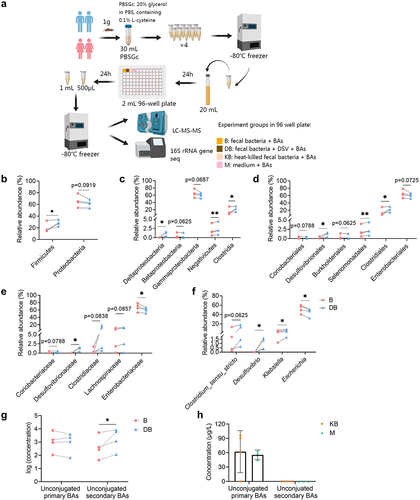
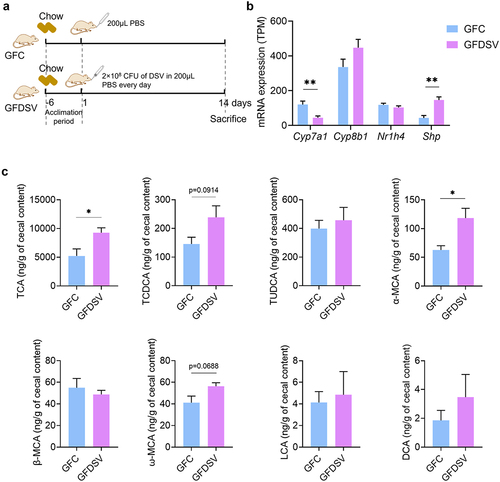
Figure 10. Effect of DSV on host BA synthesis and gut BA profile in germ-free mice. (a) mRNA expression of Cyp7a1, Cyp8b1, Nr1h4 and Shp determined by RNA-seq. (b) Concentration of TCA, TCDCA, TUDCA, α-MCA, β-MCA, ω-MCA, LCA and DCA. GCA, GCDCA, GUDCA, CA, CDCA and HDCA were under detection limit in both groups. UDCA was also not shown because it was detected in the GFDSV group but not detected in the GFC group. n = 4 mice per group. Data are represented as the mean ± SEM, two-tailed Student t-test, *p < 0.05, **p < 0.01.
Supplemental Material
Download MS Word (17.6 MB)Data availability statement
All the data are available upon request. The raw data of 16s rRNA gene sequencing generated in the first animal experiment and ex vivo experiment of fermentation of human fecal bacteria with bile acids in this study have been deposited at National Center for Biotechnology Information (BioProject ID: PRJNA1066713 and PRJNA1067359, respectively). The raw data of metagenomic sequencing in the second and third animal experiment have been deposited at National Center for Biotechnology Information (BioProject ID: PRJNA1068753). RNA-seq data of mouse livers in the first and fourth animal experiment have been uploaded to National Center for Biotechnology Information (BioProject ID: PRJNA1067360 and PRJNA600663, respectively).