
Figures & data
Figure 1. QA improved brain oxidative stress in mice subjected to HFD.
(a) MDA level. (b) Activity of GPx. (b) Activity of CAT. (d) Activity of SOD. (e) The relative expression levels of genes related to oxidative stress detected by QPCR. Data are expressed as mean ± SEM. *p < .05, **p < .01. MDA, malondialdehyde; GPx, glutathione peroxidase; CAT, catalase; SOD, superoxide dismutase.
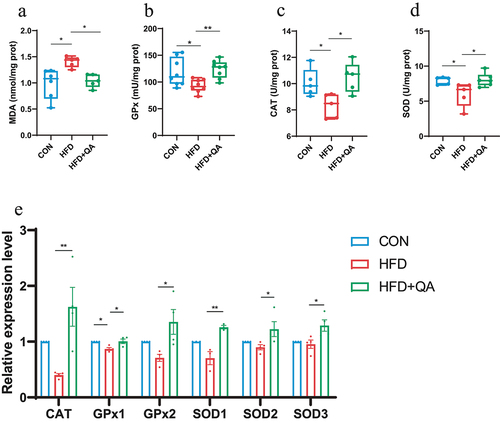
Figure 2. QA suppressed neuroinflammation and downregulated AD indicators in HFD mice.
(a) The relative expression levels of genes related to inflammatory cytokines in the brain. (b) Protein expression of TNF-α and IL-1β in brain was analyzed by western blot. (c) The relative expression levels of inflammatory cytokines in the brain were detected by QPCR. (d) The level of brain Aβ42 protein by ELISA. (e) Protein level of p-Tau/Tau in brain detected by western blot. Data are expressed as mean ± SEM, *p < .05, **p < .01, ***p < .001.
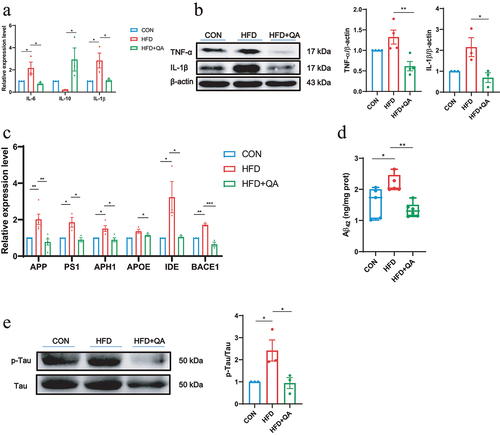
Figure 3. QA alleviated HFD-induced gut microbial dysbiosis.
(a) Shannon index on Phylum level. (b) PCoA analysis on OTU level in three groups. (c) Community abundance on phylum level. (d) Community abundance on genus level. (e) Heatmap of abundance on genus level. (f) The relative abundance of altered species. *p < .05, **p < .01, ***p < .001. PCoA, Principal component analysis; OUT, Operational Taxonomic Unit.
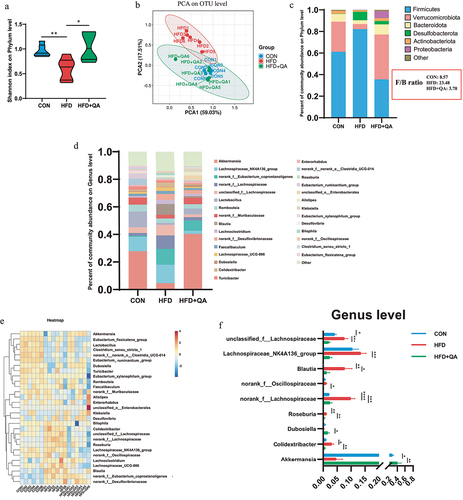
Figure 4. QA altered gut microbe-associated metabolites.
(a) PLS-DA of fecal metabolic profile. (b) Volcano map of significantly up- and down-regulated metabolites between HFD and HFD+QA group. (c) Wayne diagram. (d) KEGG pathway classification of metabolites. (e) Heatmap of differential tryptophan metabolites. (f) Correlation heatmap of tryptophan metabolites with oxidative stress indicators, inflammatory cytokines and AD indicators. (g) Ecological network among differential tryptophan metabolites with oxidative stress indicators, inflammatory cytokines and AD indicators. (h) ROC analysis of IAA and KYNA. (i) The abundance of IAA and KYNA in different groups. *p < .05, **p,< .01, ***p < .001. PLS-DA, Partial Least Squares Discrimination Analysis; ROC, Receiver Operating Characteristic; IAA, Indole-3-acetic acid; KYNA, Kynurenic acid.
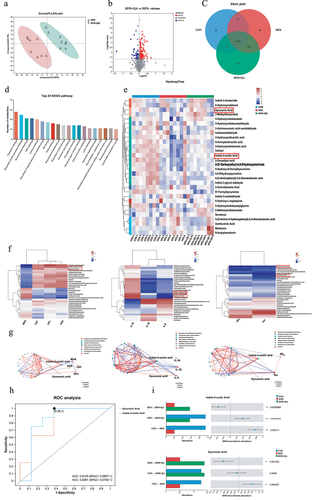
Figure 5. IAA and KYNA alleviated oxidative stress in mice subjected to HFD.
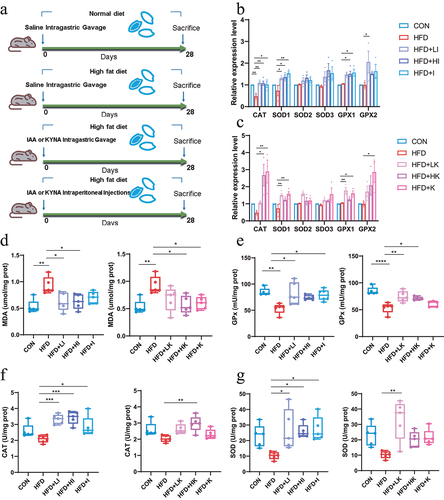
Figure 6. IAA and KYNA ameliorated inflammation of HFD mice.
(a and b) The relative expression levels of inflammatory cytokines in the brain. (c and d) Protein levels of TNF-α and IL-1β in the brain of IAA and KYNA treated mice by western blot. (e) Immunofluorescence staining of Iba-1 on mice brain slices. Data are expressed as mean± SEM, *p < .05, **p < .01, ***p < .001.
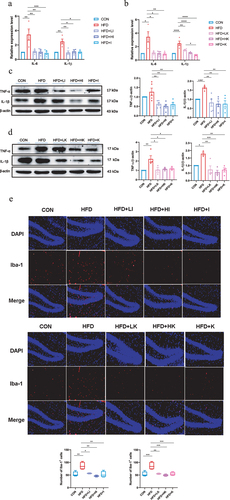
Figure 7. IAA and KYNA down-regulated AD-related indicators of HFD mice.
(a and b) The relative expression levels of AD-related genes in the brain analyzed by QPCR. (c amd d) Protein level of p-Tau/Tau in the brain detected by western blot. (e and f) The protein level of Aβ42 protein in the brain detected by ELISA. Data are expressed as mean ± SEM, *p < .05, **p < .01, ***p < .001.
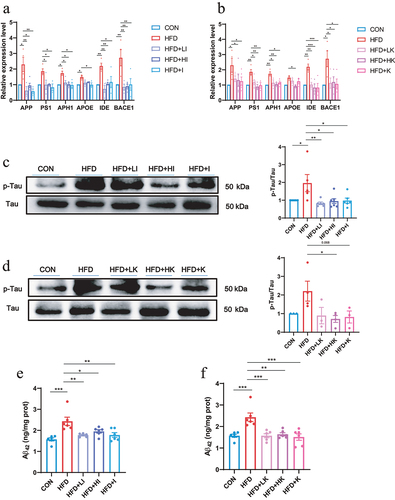
Figure 8. IAA altered the expression of genes in the brain of HFD mice.
(a) PCA analysis of gene profiles. (b) Volcano map of differential expression genes. (c) Venn diagram. (d) GSEA analysis of expressing gene sets. (e) Heatmap clustering of differential genes. (f) Reactome annotations analysis of differential genes. GSEA, Gene Set Enrichment Analysis.
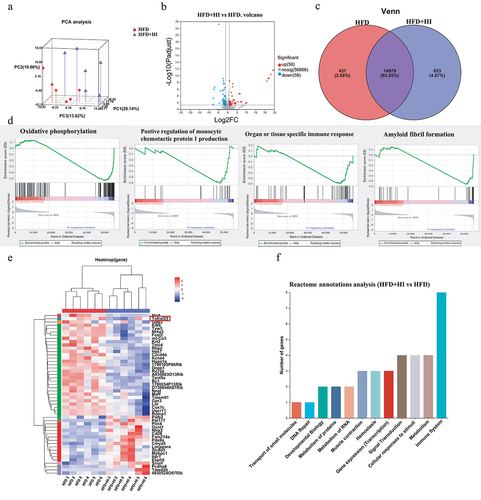
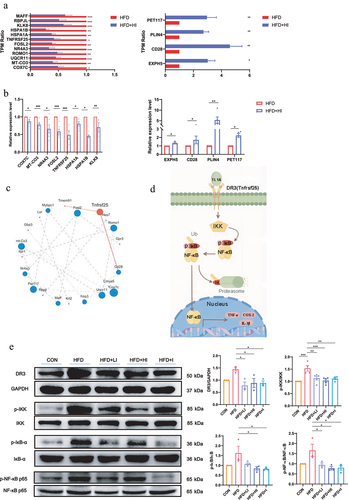
Figure 9. IAA-regulated neuroinflammation via the NF-κB signaling pathway.
(a) The TPM ratio of up-regulated and down-regulated genes. (b) The expression levels of differential expression genes in the brain detected by QPCR. (c) Analysis of protein–protein interaction networks of differential expression genes. (d) Flow chart of NF-κB signaling pathway. (e) Protein levels of DR3, p-IKK/IKK, p-IκBα/IκBα and p-NF-κB/NF-κB in the brain detected by western blot. Data are expressed as mean±SEM, *p < .05, **p < .01, ***p < .001, ****p < .0001.
Supplemental material
Supplementary information.docx
Download MS Word (742 KB)WB.docx
Download MS Word (5.2 MB)Data availability statement
The data are available from the corresponding author on reasonable request.