2,647
Views
40
CrossRef citations to date
0
Altmetric
Extra View

The selective permeability barrier in the nuclear pore complex

, &
Pages 430-446 | Received 19 Jul 2016, Accepted 13 Sep 2016, Published online: 01 Nov 2016

Figures & data

Table 1. Interactions between transport receptors and FG-Nups. √ refers obvious interaction; w represents weak interaction; x means no interaction; n/a means not available. The information in the table is collected from previous publicationCitation75 with permission.

Figure 1. 3D Probability Density Map of the FG-Nups barrier in the native NPC. 3D probability density (green clouds) and heat maps of the FG-Nups barrier in the NPC superimposed on the NPC architecture (gray) are shown in both cut-away side view (A-B) and top view (C-D). The passive diffusion route (red clouds) is added in the side view to highlight the relative spatial locations of passive and facilitated diffusion pathways through the native NPC. Both the Cartesian (x, y, z) and cylindrical (x, r, θ) coordinates are shown for these 3D and slice views. Sub-regions in the FG-Nups barrier are labeled in (B) and (D). Red represents the highest density (H) and black the lowest (L) in the color column bar. N, the nucleoplasmic side of the NPC. C, the cytoplasmic side of the NPC. The figures are adapted from previous publicationCitation75 with permission.
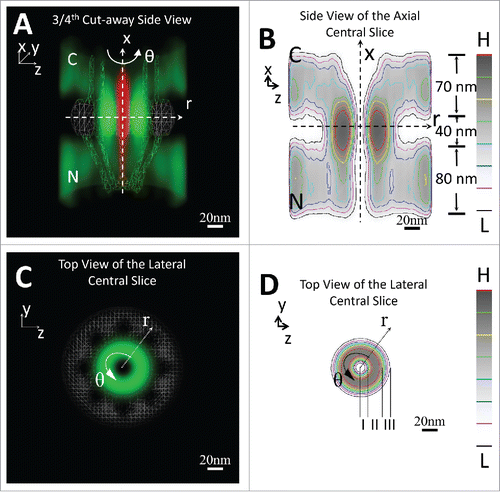
Figure 1. 3D Probability Density Map of the FG-Nups barrier in the native NPC. 3D probability density (green clouds) and heat maps of the FG-Nups barrier in the NPC superimposed on the NPC architecture (gray) are shown in both cut-away side view (A-B) and top view (C-D). The passive diffusion route (red clouds) is added in the side view to highlight the relative spatial locations of passive and facilitated diffusion pathways through the native NPC. Both the Cartesian (x, y, z) and cylindrical (x, r, θ) coordinates are shown for these 3D and slice views. Sub-regions in the FG-Nups barrier are labeled in (B) and (D). Red represents the highest density (H) and black the lowest (L) in the color column bar. N, the nucleoplasmic side of the NPC. C, the cytoplasmic side of the NPC. The figures are adapted from previous publicationCitation75 with permission.

Figure 2. FG-Nups barrier obtained from molecular simulation, cryo-EM and SPEED microscopy. FG-domains (green) of the FG-Nups barrier revealed by coarse-grained MD simulation (A) and SPEED microscopy (B) are shown in cross-section view at the NPC scaffold (gray). Shown in nucleocytoplasmic transport axial view, 2 distinct transport routes (route 1 and 2 in C) recently detected by cryo-EM agree with the passive (red) and facilitated (green) transport routes through the native NPCs previously identified by SPEED microscopy (D). Numbers denote nanometers in D. The figures are adapted from previous publicationsCitation75-77 with permission.

Figure 2. FG-Nups barrier obtained from molecular simulation, cryo-EM and SPEED microscopy. FG-domains (green) of the FG-Nups barrier revealed by coarse-grained MD simulation (A) and SPEED microscopy (B) are shown in cross-section view at the NPC scaffold (gray). Shown in nucleocytoplasmic transport axial view, 2 distinct transport routes (route 1 and 2 in C) recently detected by cryo-EM agree with the passive (red) and facilitated (green) transport routes through the native NPCs previously identified by SPEED microscopy (D). Numbers denote nanometers in D. The figures are adapted from previous publicationsCitation75-77 with permission.

Figure 3. Effective interaction zones for each NTR and competition among multiple NTRs in the FG-Nups barrier of the native NPC. (A) The schematic represents the effective strong (darker color) and weak (lighter color) interaction zones between FG-domains (green clouds containing curved lines) and different NTRs including importins (Impß1, Impß2, and NTF2) and exportins (Crm1, CAS, and Tap-p15). Numbers denote nanometers. C, the cytoplasmic side of NPC; N, the nucleoplasmic side of NPC. (B) This figure is the representation of light (left) and heavy (right) competition among NTRs. Specifically, NTRs could find more available binding sites in the FG-Nups barrier (green clouds containing curved lines) under light competition conditions than heavy competition circumstances.
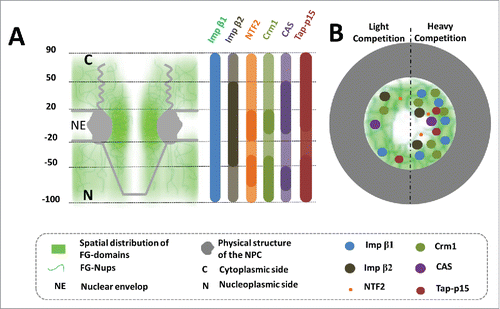
Figure 3. Effective interaction zones for each NTR and competition among multiple NTRs in the FG-Nups barrier of the native NPC. (A) The schematic represents the effective strong (darker color) and weak (lighter color) interaction zones between FG-domains (green clouds containing curved lines) and different NTRs including importins (Impß1, Impß2, and NTF2) and exportins (Crm1, CAS, and Tap-p15). Numbers denote nanometers. C, the cytoplasmic side of NPC; N, the nucleoplasmic side of NPC. (B) This figure is the representation of light (left) and heavy (right) competition among NTRs. Specifically, NTRs could find more available binding sites in the FG-Nups barrier (green clouds containing curved lines) under light competition conditions than heavy competition circumstances.

Reprints and Corporate Permissions

Please note: Selecting permissions does not provide access to the full text of the article, please see our help page How do I view content?

To request a reprint or corporate permissions for this article, please click on the relevant link below:

Academic Permissions

Please note: Selecting permissions does not provide access to the full text of the article, please see our help page How do I view content?

Obtain permissions instantly via Rightslink by clicking on the button below:

If you are unable to obtain permissions via Rightslink, please complete and submit this Permissions form. For more information, please visit our Permissions help page.