1,511
Views
8
CrossRef citations to date
0
Altmetric
Original Research

Comparing lamin proteins post-translational relative stability using a 2A peptide-based system reveals elevated resistance of progerin to cellular degradation

, , &
Pages 585-596 | Received 09 Sep 2016, Accepted 10 Nov 2016, Published online: 08 Dec 2016

Figures & data

Figure 1. Schematic diagrams of processing and creation of 2A constructs. (A) Processing of 2A-linked constructs. DNA sequences of Polypeptide 1 and 2 are connected by a 2A motif and transcribed into a single ORF. The two polypeptides are then separated during translation by a co-translational, intraribosomal cleavage right before the proline at the end of the 2A sequence, resulting the proline at the N-terminus of polypeptide 2. (B) Generation of luciferase-P2A-lamin (lamin A, progerin, lamin B1) constructs. Segments of luciferase-P2A and EGFP tagged lamins were amplified and linked together via PCR. The subsequent long fragment was subcloned between the BamHI and NotI sites on the lentivector of pHR-SIN-CSGW dlNotI plasmid.
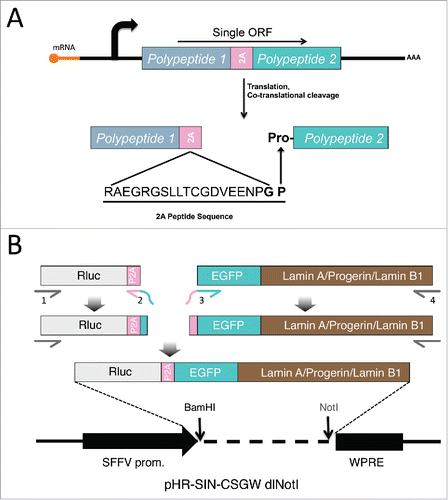
Figure 1. Schematic diagrams of processing and creation of 2A constructs. (A) Processing of 2A-linked constructs. DNA sequences of Polypeptide 1 and 2 are connected by a 2A motif and transcribed into a single ORF. The two polypeptides are then separated during translation by a co-translational, intraribosomal cleavage right before the proline at the end of the 2A sequence, resulting the proline at the N-terminus of polypeptide 2. (B) Generation of luciferase-P2A-lamin (lamin A, progerin, lamin B1) constructs. Segments of luciferase-P2A and EGFP tagged lamins were amplified and linked together via PCR. The subsequent long fragment was subcloned between the BamHI and NotI sites on the lentivector of pHR-SIN-CSGW dlNotI plasmid.

Figure 2. Comparing relative stability of lamin A, progerin and lamin B1 in human fibroblasts. (A) Western blotting analysis of viral infected human fibroblasts. Protein samples were immunoblotted with antibodies of GFP, lamin A/C, lamin B1, luciferase and β-actin. Non-infected fibroblast cells were used as a negative control. (B) Confocal fluorescence images. Infected fibroblasts expressing 2A-lamins (green) were fixed and stained with anti-lamin B1 (red) by immunofluorescence at 48 hours post infection. DNA was stained with DAPI (blue). A representative cell under each condition is shown. Bars, 10 μm. (C) Western blotting analysis on time course of viral infected human fibroblasts. Protein samples were immunoblotted with antibodies of GFP, luciferase and β-actin. (D) Quantification of lamins' relative stabilities in (C). The relative stability was calculated as the intensity ratio of EGFP/luciferase. Bar graph shows the average of day 5 to day 7 data. Results were generated from 3 biological replicates. *P < 0.05, **P < 0.01. P2A-LA, P2A-PG and P2A-LB1 refer to the constructs of luciferase-P2A-lamin A, luciferase-P2A-progerin and luciferase-P2A-lamin B1.
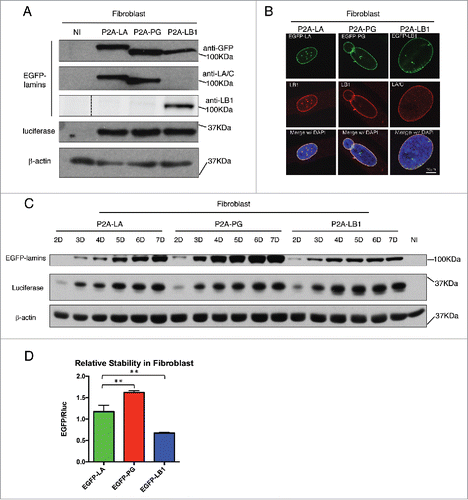
Figure 2. Comparing relative stability of lamin A, progerin and lamin B1 in human fibroblasts. (A) Western blotting analysis of viral infected human fibroblasts. Protein samples were immunoblotted with antibodies of GFP, lamin A/C, lamin B1, luciferase and β-actin. Non-infected fibroblast cells were used as a negative control. (B) Confocal fluorescence images. Infected fibroblasts expressing 2A-lamins (green) were fixed and stained with anti-lamin B1 (red) by immunofluorescence at 48 hours post infection. DNA was stained with DAPI (blue). A representative cell under each condition is shown. Bars, 10 μm. (C) Western blotting analysis on time course of viral infected human fibroblasts. Protein samples were immunoblotted with antibodies of GFP, luciferase and β-actin. (D) Quantification of lamins' relative stabilities in (C). The relative stability was calculated as the intensity ratio of EGFP/luciferase. Bar graph shows the average of day 5 to day 7 data. Results were generated from 3 biological replicates. *P < 0.05, **P < 0.01. P2A-LA, P2A-PG and P2A-LB1 refer to the constructs of luciferase-P2A-lamin A, luciferase-P2A-progerin and luciferase-P2A-lamin B1.
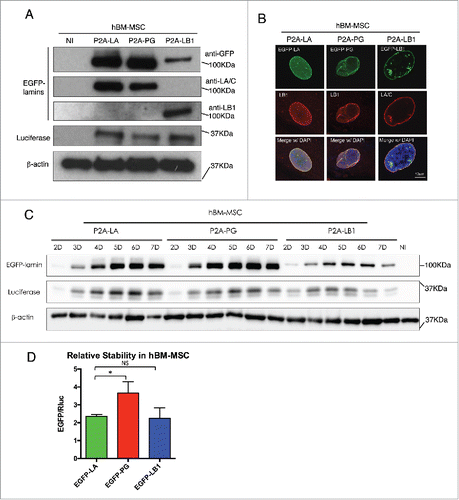
Figure 3. Comparing relative stability of lamin A, progerin and lamin B1 in hBM-MSCs. (A) Western blotting analysis of viral infected hBM-MSCs. Protein samples were immunoblotted with antibodies of GFP, lamin A/C, lamin B1, luciferase and β-actin. Non-infected hBM-MSCs cells were used as a negative control. (B) Confocal fluorescence images of infected hBM-MSCs expressing 2A-lamins (green) and stained with anti-lamin B1 (red) by immunofluorescence at 48 hours post infection. DNA was stained with DAPI (blue). A representative cell under each condition is shown. Bars, 10 μm. (C) Time course of viral infected hBM-MSCs were analyzed by Western blotting. Antibodies of GFP, luciferase and β-actin were utilized for immunoblotting. (D) Quantification of lamins' relative stabilities in (C) was calculated as the intensity ratio of EGFP/luciferase. Bar graph shows the average of day 5 to day 7 data. Results were generated from 3 biological replicates. *P < 0.05, **P < 0.01. P2A-LA, P2A-PG and P2A-LB1 refer to the constructs of luciferase-P2A-lamin A, luciferase-P2A-progerin and luciferase-P2A-lamin B1.
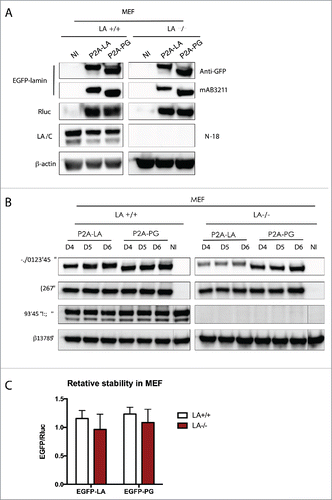
Figure 3. Comparing relative stability of lamin A, progerin and lamin B1 in hBM-MSCs. (A) Western blotting analysis of viral infected hBM-MSCs. Protein samples were immunoblotted with antibodies of GFP, lamin A/C, lamin B1, luciferase and β-actin. Non-infected hBM-MSCs cells were used as a negative control. (B) Confocal fluorescence images of infected hBM-MSCs expressing 2A-lamins (green) and stained with anti-lamin B1 (red) by immunofluorescence at 48 hours post infection. DNA was stained with DAPI (blue). A representative cell under each condition is shown. Bars, 10 μm. (C) Time course of viral infected hBM-MSCs were analyzed by Western blotting. Antibodies of GFP, luciferase and β-actin were utilized for immunoblotting. (D) Quantification of lamins' relative stabilities in (C) was calculated as the intensity ratio of EGFP/luciferase. Bar graph shows the average of day 5 to day 7 data. Results were generated from 3 biological replicates. *P < 0.05, **P < 0.01. P2A-LA, P2A-PG and P2A-LB1 refer to the constructs of luciferase-P2A-lamin A, luciferase-P2A-progerin and luciferase-P2A-lamin B1.
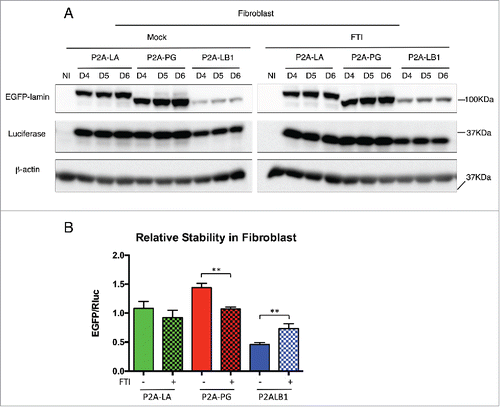
Figure 4. Examining lamin relative stabilities in both LA+/+ and LA-/- MEFs. (A) Western blotting analysis of viral infected MEF cells. Proteins were probed with antibodies of GFP, human lamin A/C (mAB3211, which only recognizes human lamin A/C), lamin A/C (N-18), luciferase and β-actin. Non-infected cells were used as a negative control. (B) Time course of viral infected hBM-MSCs were analyzed by Western blotting. Antibodies of GFP, luciferase, human lamin A/C and β-actin were utilized for immunoblotting. (C) The quantification was calculated as the intensity ratio of EGFP/luciferase. Bar graph shows the average of day 4 to day 6 data. Results were generated from 3 biological replicates. P2A-LA, P2A-PG and P2A-LB1 refer to the constructs of luciferase-P2A-lamin A, luciferase-P2A-progerin and luciferase-P2A-lamin B1.

Figure 4. Examining lamin relative stabilities in both LA+/+ and LA-/- MEFs. (A) Western blotting analysis of viral infected MEF cells. Proteins were probed with antibodies of GFP, human lamin A/C (mAB3211, which only recognizes human lamin A/C), lamin A/C (N-18), luciferase and β-actin. Non-infected cells were used as a negative control. (B) Time course of viral infected hBM-MSCs were analyzed by Western blotting. Antibodies of GFP, luciferase, human lamin A/C and β-actin were utilized for immunoblotting. (C) The quantification was calculated as the intensity ratio of EGFP/luciferase. Bar graph shows the average of day 4 to day 6 data. Results were generated from 3 biological replicates. P2A-LA, P2A-PG and P2A-LB1 refer to the constructs of luciferase-P2A-lamin A, luciferase-P2A-progerin and luciferase-P2A-lamin B1.

Figure 5. Effects of FTI on lamins relative stabilities in human fibroblasts. (A) Western blotting analysis of viral infected fibroblasts upon the treatment of FTI. DMSO treated cells were mock control. (B) Quantification of the relative stability in (A) is presented as EGFP/luciferase ratios. Bar graph shows the average of day 4 to day 6 data. Results were generated from 3 biological replicates. *P < 0.05, **P < 0.01. P2A-LA, P2A-PG and P2A-LB1 refer to the constructs of luciferase-P2A-lamin A, luciferase-P2A-progerin and luciferase-P2A-lamin B1.

Figure 5. Effects of FTI on lamins relative stabilities in human fibroblasts. (A) Western blotting analysis of viral infected fibroblasts upon the treatment of FTI. DMSO treated cells were mock control. (B) Quantification of the relative stability in (A) is presented as EGFP/luciferase ratios. Bar graph shows the average of day 4 to day 6 data. Results were generated from 3 biological replicates. *P < 0.05, **P < 0.01. P2A-LA, P2A-PG and P2A-LB1 refer to the constructs of luciferase-P2A-lamin A, luciferase-P2A-progerin and luciferase-P2A-lamin B1.
Supplemental material

KNCL_A_1260803_Supplementary_Materials.zip

Download Zip (6.2 MB)