
Figures & data
Table 1. Descriptive statistics.
Table 2. Pearson correlation matrix of variables.
Figure 1. German energy efficiency classes of residential buildings according to German Building Energy Act. (Source: Own depiction).
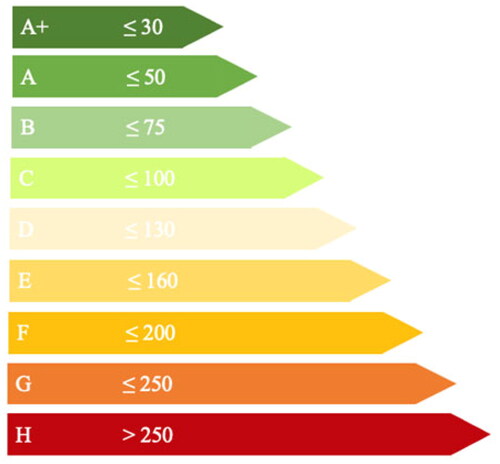
Table 3. Summary statistics and Pearson correlation coefficients for EPC classes.
Figure 2. Frequency distribution of building efficiency classes according to the final energy demand in the German building stock (Source: Own depiction according to BMWi, Citation2020).
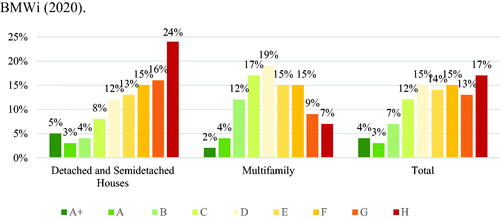
Table 4. Descriptive statistics for green retrofit data.
Table 5. Pearson correlation coefficients for green retrofit data.
Table 6. Regression results for energy-related exogenic variables on log rent €/m2.
Figure 3. Derivation of the marginal benefit curve. (Source: Own depiction).
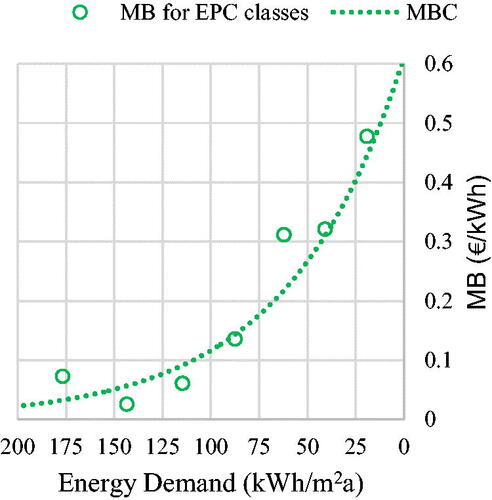
Figure 4. Derivation of the marginal cost curve for energy demand (a) and energy consumption (b). (Source: Own depiction).
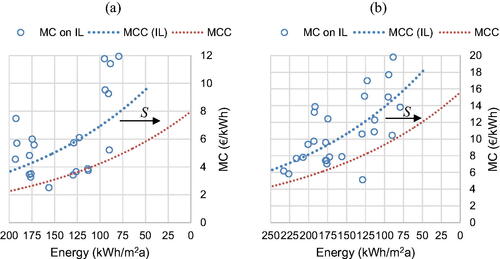
Figure 5. Marginal cost curves, marginal benefit curve and energy cost saving. (Source: Own depiction).
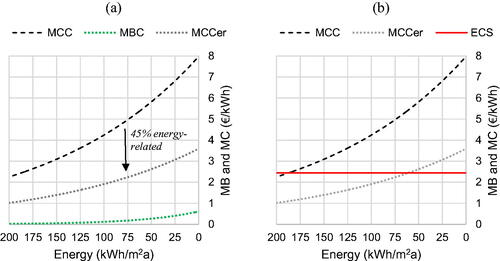
Table 7. Distribution of the CO2-tax burden by EPC classes on tenant and landlord.
Figure 6. Marginal cost curves, marginal benefit curve and energy cost saving. (Source: Own depiction).
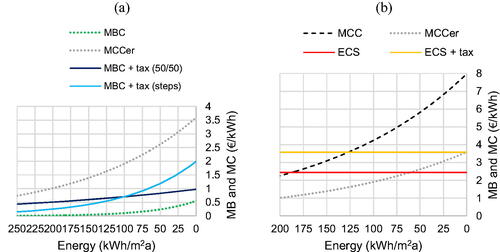
Table A1. Full regression results for response variable: log rent €/m2.
Table A2. Calculation of marginal benefit for each EPC class.