
Figures & data
Figure 1. HOLC map legend.
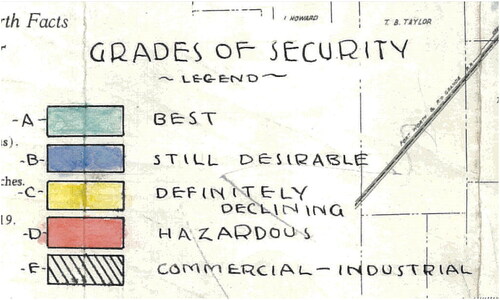
Figure 2. HOLC map legend.
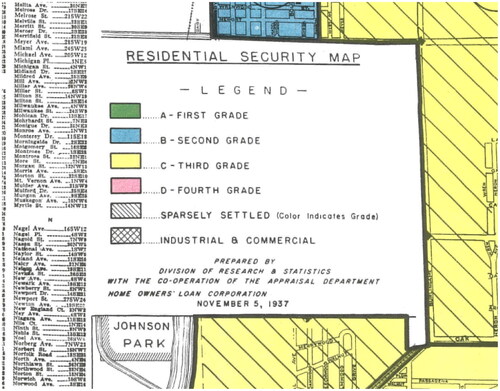
Figure 3. Pontiac A-1.
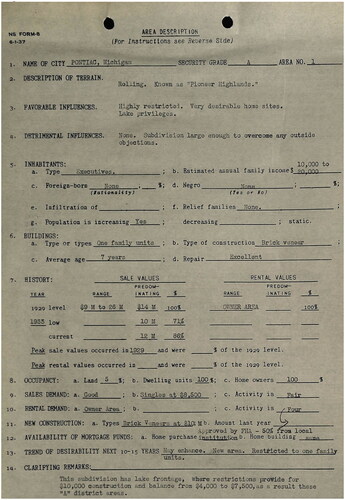
Figure 4. Pontiac D-5.
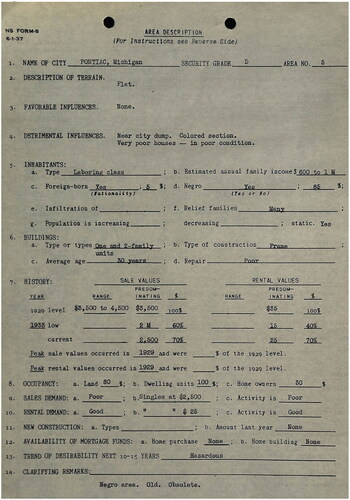
Table 1. Descriptive Statistics.
Figure 5. Detroit. This figure shows the A rated parcels (Green), B rated parcels (Blue), C rated parcels (Yellow), and D rated parcels (Red) in Detroit. The black dots represent parcels held by the Michigan State Land Bank (SLBA).
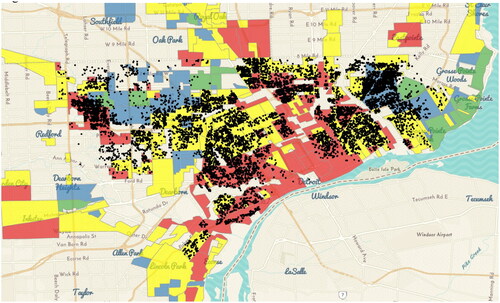
Figure 6. Grand Rapids. This figure shows the A rated parcels (Green), B rated parcels (Blue), C rated parcels (Yellow), and D rated parcels (Red) in Grand Rapids. The black dots represent parcels held by the Michigan State Land Bank (SLBA).
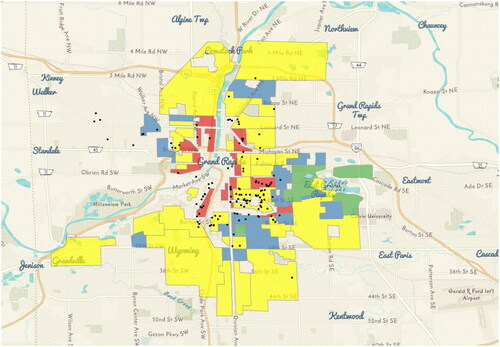
Figure 7. Flint.
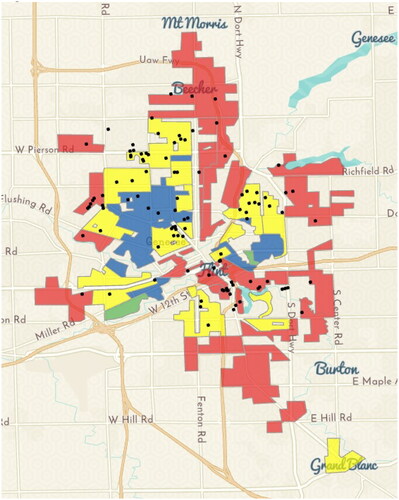
Table 2. Detroit SLBA-Non-SLBA Parcels.
Table 3. Grand Rapids SLBA-Non-SLBA Parcels.
Table 4. Flint SLBA-Non-SLBA Parcels.