
Figures & data
Figure 1. Maximum monthly tide height in Charleston harbor, 2005–2023.
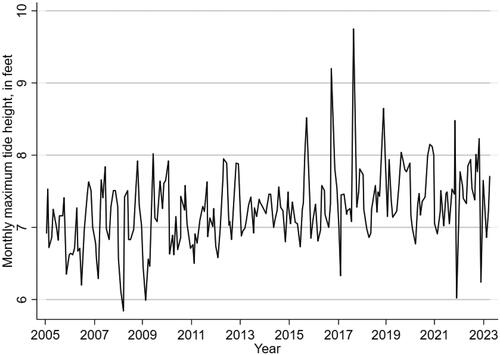
Figure 2. Flood impacted areas by flood proxy. (a) Gray areas represent the 100-year flood zones in Panel A, predicted storm surge inundation areas from the SLOSH model for a category 1 hurricane in Panel B, and predicted inundation areas from 4-feet of sea level rise in Panel C; (b) the Charleston peninsula is outlined in black; (c) dotted areas represent Charleston harbor and its surrounding tributaries; (d) the solid black area represents the mainland.
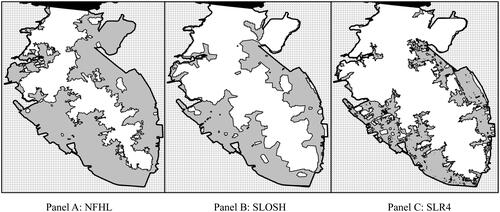
Figure 3. Number of steps versus flood certificate height. (a) The figure above plots the flood certificate height versus the number of steps for all homes with flood certificate data.
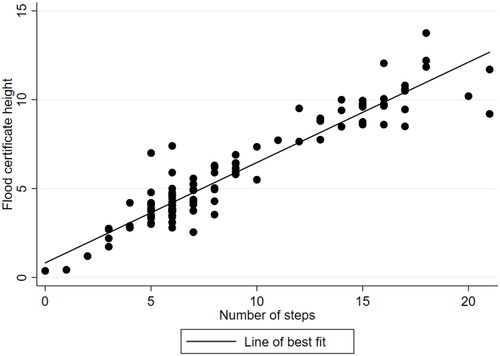
Table 1. Summary statistics.
Table 2. Home and transaction characteristics by group.
Figure 4. Non-elevated and elevated home location. (a) Panel A shows the location of non-elevated homes while Panel B shows the location of elevated homes; (b) an elevated home is defined as one having 12 or more steps between the ground and front door landing; (c) the Charleston peninsula is outlined in black; (d) dotted areas represent Charleston harbor and its surrounding tributaries; (e) gray areas are those in the 100-year flood plain under the National Flood Hazard Layer (NFHL).
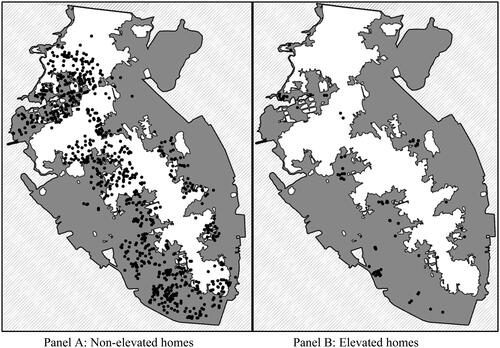
Table 3. Empirical results.
Figure 5. Parallel trends by flood impact measure. (a) The above panels show lines of best fit through the unconditional mean sale prices for non-flood-impacted (solid line) and flooded-impacted homes (long dashed line) by the number of years to and from October 5, 2015.
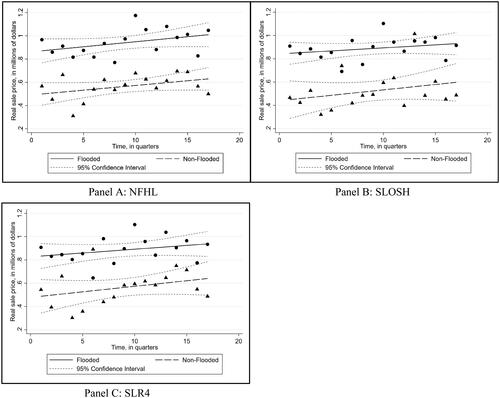
Table 4. Empirical tests of the parallel trends assumption.
Table 5. Changes in socio-demographic characteristics by treatment group and treatment period for the NFHL flood proxy.
Table 6. Results using height above base flood elevation to delineate elevated homes.