Figures & data
Figure 1. Experimental design.
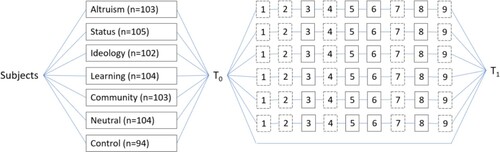
Table 1. Variables.
Table 2. Descriptive statistics (n = 715).
Table 3. Regression models of new uploads (n = 715).
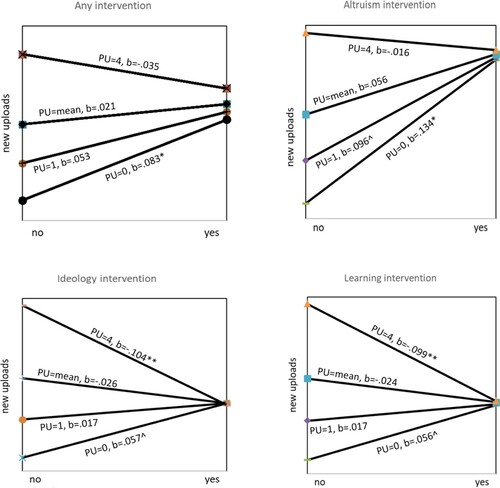
Figure 2. Simple slope regression lines between new uploads and various interventions, at specific values of prior uploads. Notes: Simple regression coefficients are shown between new uploads and any intervention (top-left), and between new uploads and the altruism (top-right), ideology (bottom-left) and learning interventions (bottom-right), when prior uploads were none (PU = 0), one (PU = 1), average (PU = mean) or four designs (PU = 4). ‘Yes’ and ‘no’ indicates that the corresponding intervention (related to the motive at hand) was present or absent. Two-tailed significance **p < .01, *p < .05 and ^p < .10.