634
Views
7
CrossRef citations to date
0
Altmetric
Articles

Inhibitory effect of Ssanghwa-tang on bone loss in ovariectomized rats

, , , , , & show all
Pages 283-289 | Received 25 May 2010, Accepted 29 Sep 2010, Published online: 10 Dec 2010

Figures & data

Figure 1.  Effects of SHT on (A) cell growth, (B) RANKL-induced TRAP activity and (C) formation of TRAP-positive multinucleated osteoclasts in RAW264.7 cells. RAW264.7 cells were placed in a 96-well plate at a density of 1×10³ cells/well with or without RANKL (100 ng/mL). The cells were incubated with different concentrations of SHT (25–200 µg/mL) for 3 days, and multinucleated osteoclasts were observed under a microscope. Cell viability was tested with CCK-8 assay. TRAP activity and staining were performed as described in Materials and methods. * P<0.05; ** P<0.01.
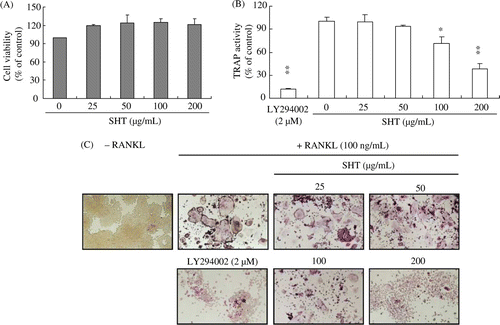
Figure 1.  Effects of SHT on (A) cell growth, (B) RANKL-induced TRAP activity and (C) formation of TRAP-positive multinucleated osteoclasts in RAW264.7 cells. RAW264.7 cells were placed in a 96-well plate at a density of 1×10³ cells/well with or without RANKL (100 ng/mL). The cells were incubated with different concentrations of SHT (25–200 µg/mL) for 3 days, and multinucleated osteoclasts were observed under a microscope. Cell viability was tested with CCK-8 assay. TRAP activity and staining were performed as described in Materials and methods. * P<0.05; ** P<0.01.

Table 1. Effect of SHT on RANKL included in RNA expression differentiation related genes in RAW264.7 cells

Figure 2.  Change in body weight of rats during SHT administration for 12 weeks. The body weights of OVX and SHT (0.6 g/kg BID) groups were significantly increased for 12 weeks when compared to the sham group (P<0.01).
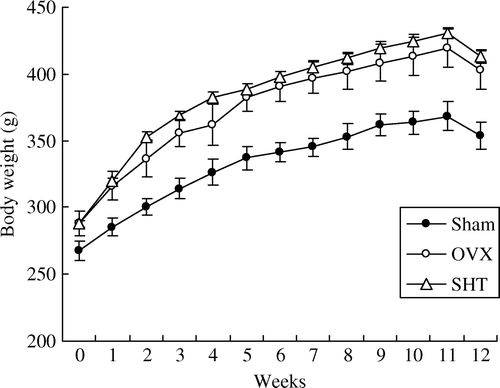
Figure 2.  Change in body weight of rats during SHT administration for 12 weeks. The body weights of OVX and SHT (0.6 g/kg BID) groups were significantly increased for 12 weeks when compared to the sham group (P<0.01).

Table 2. Effect of SHT on RANKL uterine weight and blochemical parameters in serum of ovx rats

Figure 3.  Histomorphological analysis of (A) femur (× 20) and (B) uterus (× 40). After SHT administration (0.6 g/kg BID) for 12 weeks, the femur and uterus of each animal were fixed and stained with H&E as described in Materials and methods. Representative photomicrographs from the sham, OVX and SHT groups. Arrow, growth plate; arrow head, trabeculae.
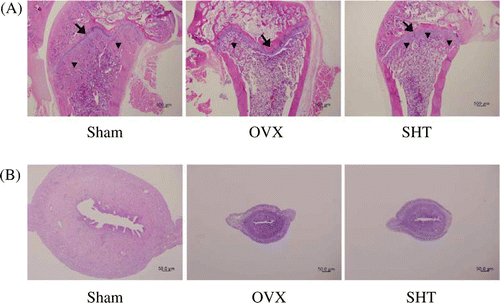
Figure 3.  Histomorphological analysis of (A) femur (× 20) and (B) uterus (× 40). After SHT administration (0.6 g/kg BID) for 12 weeks, the femur and uterus of each animal were fixed and stained with H&E as described in Materials and methods. Representative photomicrographs from the sham, OVX and SHT groups. Arrow, growth plate; arrow head, trabeculae.

Table 3. Effect of SHT on BMD of OVX rats

Table 4. Content of marker components in SHT

Reprints and Corporate Permissions

Please note: Selecting permissions does not provide access to the full text of the article, please see our help page How do I view content?

To request a reprint or corporate permissions for this article, please click on the relevant link below:

Academic Permissions

Please note: Selecting permissions does not provide access to the full text of the article, please see our help page How do I view content?

Obtain permissions instantly via Rightslink by clicking on the button below:

If you are unable to obtain permissions via Rightslink, please complete and submit this Permissions form. For more information, please visit our Permissions help page.