Figures & data
Table 1. Primer pairs used to amplify the IGFBP-3 promoter region.
Figure 1. SNPs in the IGFBP-3 promoter region.
Note: Based on the Genbank of IGFBP-3 promoter sequence (Gene ID: 448812), between the –2096 and –2095 bp, there was detected an insertion of ‘T’; the –1980 and –1979 bp were deficiency ‘CA’ simultaneously. The –1675 bp was deficiency ‘G’; an insertion was detected between the –1272 and –1271 bp, the insertion sequences were ‘CCGGTTCCCATCCTG’ and were expressed as ‘I’ in this table; The –788 and –789 bp were deficiency ‘AA’ simultaneously. Three SNPs have no RefSNP ID (g.-2096, -2095 -/T; g.-1981 A>C and g.-1055 G>A).
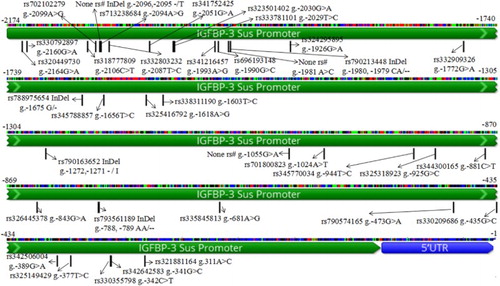
Table 2. Genetic diversity parameters of the IGFBP-3 promoter regiona in pig breeds.
Figure 2. Perfect LD structure and haplotypes for the 13 SNPs (r2 = 1) located in the IGFBP-3 promoter region.
Note: LD blocks are marked with triangles. The numbers in the boxes represent the LD estimated according to the r2 values between pairs of SNPs. The boxes without numbers indicate complete LD at r2 = 1. The boxes were coloured in accordance with the standard Haploview colour scheme: LD > 2 and D′ = 1, red; LD > 2 and D′ < 1, shades of pink/red; LD < 2 and D′ = 1, white.
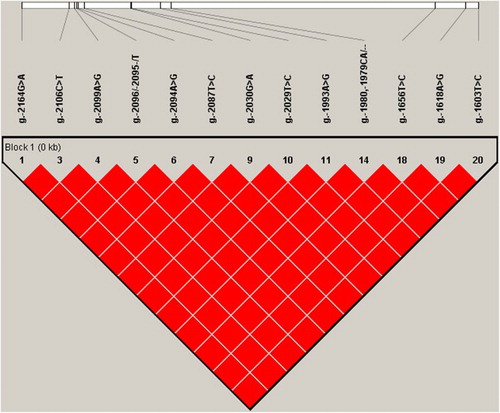
Table 3. Haplotypes of block 1 () and the frequency distributions in the pig breeds.
Figure 3. The haplotypes (h1, h2) of the promoter region are associated with the IGFBP-3 mRNA expression level in liver and muscle tissues of three pig breeds (JM, TM and BM).
Note: There are six samples (three for h1 and three for h2 haplotypes) collected from the JM and TM breeds, while three samples of h2 haplotype collected from the BM breed due to no h1 haplotype was found in BM breed in this study. Values are presented as mean ± SEM, and the differences between groups were determined by the multiple T tests (GraphPad Prism 6). When P < .05, the results are statistically significant and marked with an asterisk (*).