
Figures & data
Table 1. Clinical information of donated human brain tissues.
Table 2. Summary of human urine samples.
Table 3. Summary of used antibodies for western blot.
Figure 1. Increases in fibrillar α-syn oligomer by the ectopic expression of G2019S LRRK2. (A) Expression of myc-tagged G2019S LRRK2 (myc-tag) and its autophosphorylation on the S1292 site (pS1292-LRRK2) analyzed with western blot. The measured intensity of protein bands normalized with β-actin levels and presented. Two-way ANOVA with Tukey post hoc test applied (n = 5). The lysates of cells transfected with vector or G2019S analyzed using ELISAs for Total-αS (B) and Fila-αS (C), and Fila-αS levels normalized with Total-αS are presented as the ratio of Fila-αS/Total-αS (D). Concentrates of culture media subjected to ELISAs of Total-αS (E) and Fila-αS (F), and the ratio of Fila-αS levels divided by Total-αS (G) are estimated. Student’s t-test was used for statistical analysis (n = 5).
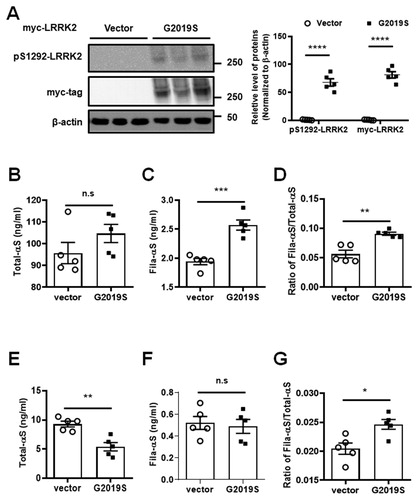
Figure 2. Analyses of α-syn along with LRRK2 in human brain SN tissues from PD patients and non-PD subjects. The lysates of SN tissues analyzed using the ELISA of Total-αS (A) and Fila-αS (B), and the ratio of Fila-αS/Total-αS (C) is estimated. Student’s t-test used for statistical analysis (n = 3). (D) For western blot, 20 µl of ELISA samples used, and the levels of total LRRK2 and pS1292-LRRK2 shown. (E) The levels of pS1292-LRRK2 or total LRRK2 of PD patients compared with the Total-αS (square), Fila-αS (opened circle), and the ratio of Fila-αS/Total-αS (reversed triangle). X-axis represents the densitometry levels of PD patients’ pS1292-LRRK2 and total LRRK2 protein bands. The correlation curve was interpolated using a linear standard curve and presented without the 95% confidence bands of the best-fit line.
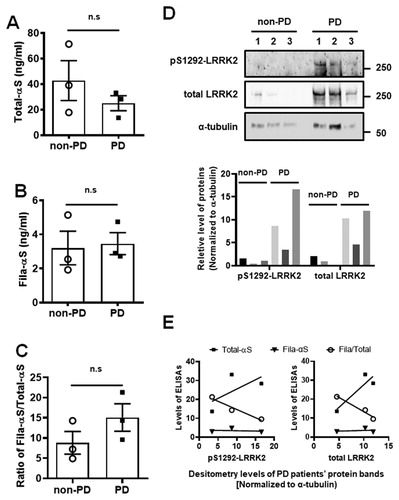
Figure 3. Quantification of urinary total α-syn and fibrillar oligomer α-syn. Urine samples from non-PD and PD patients was subjected to Total-αS (A) or Fila-αS (C), and the ratio of Fila-αS/Total- αS was estimated (E). The ROC curves for Total-αS (AUC = 0.75) (B), Fila-αS (AUC = 0.509) (D), or the ratio of Fila-αS/Total-αS (AUC = 0.74) (F) was computed. Dotted line: random classifier.
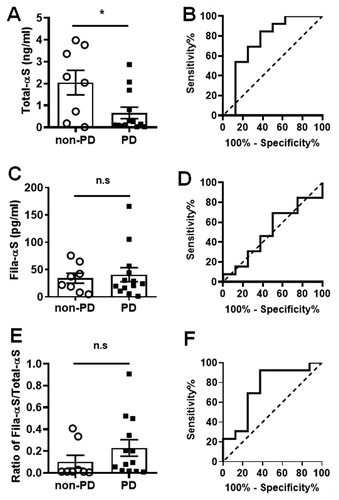
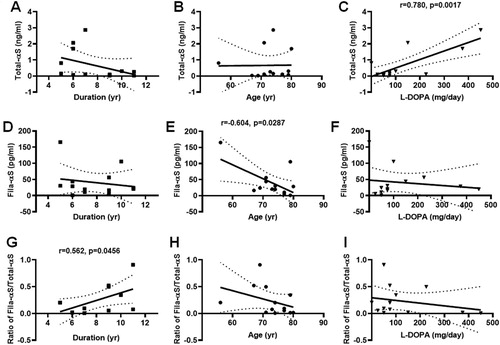
Figure 4. Correlations of urinary α-syn with various parameters of PD. The levels of Total-αS in the urine compared with the on-set duration (A), age (B), and L-DOPA dosage (C). The levels of Fila-αS in the urine compared with the on-set duration (D), age (E), and L-DOPA (F). The ratio of Fila-αS/Total-αS estimated, and its correlation with the on-set duration (G), age (H), and the administration dose of L-DOPA determined (I). All XY correlations was computed by Pearson correlation coefficient (PD = 13).
Supplemental Material
Download PDF (166.3 KB)Data availability statement
The datasets generated during and/or analyzed during the current study are available from the corresponding author on reasonable request.