Figures & data
Table 1. Qualitative analysis of ethanol extract of G. olivieri.
Figure 1. Change in the consumed amount of sucrose solution in time following chronic administration of GOEE and imipramine in the chronic mild stress model
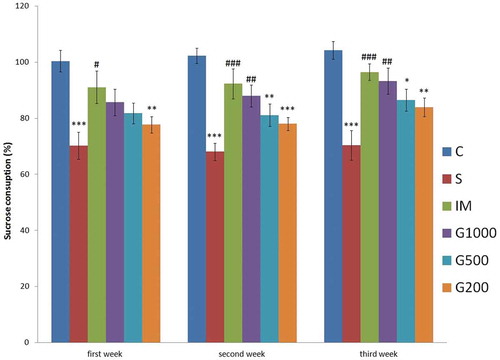
Figure 2. Liver index changes following chronic administration of GOEE and imipramine for 3 weeks in the chronic mild stress model
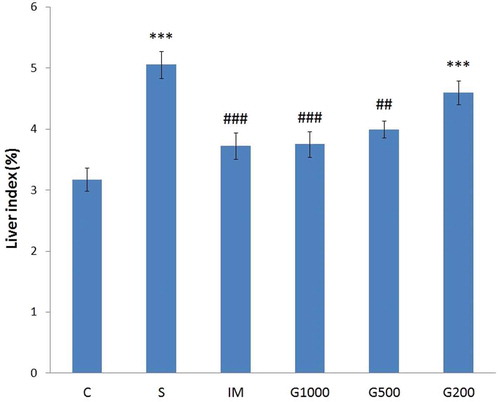
Figure 3. Monoamine levels in the hippocampus following chronic administration of GOEE and imipramine for 3 weeks
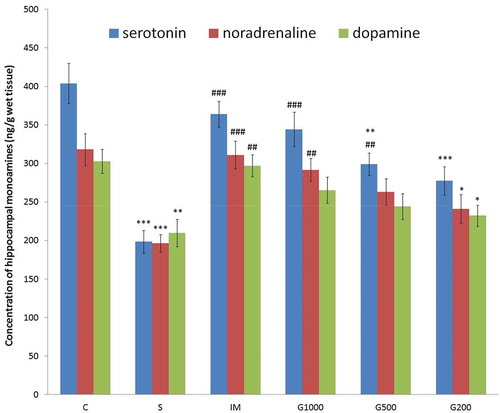
Figure 4. Serum corticosterone levels following chronic administration of GOEE and imipramine for 3 weeks
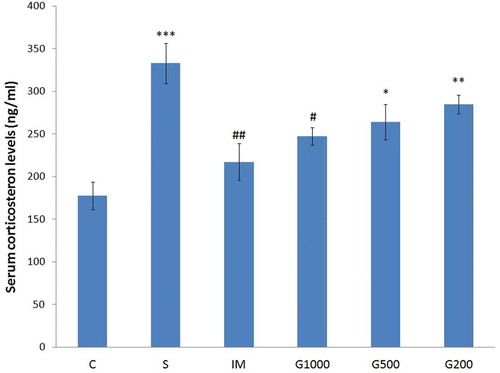
Figure 5. Serum levels of proinflammatory cytokines (a: TNF-α, b: IL-6) following chronic administration of GOEE and imipramine for 3 weeks
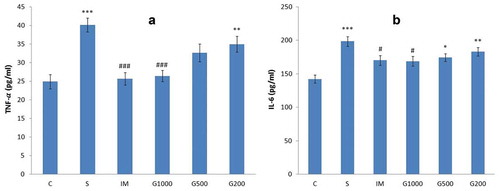
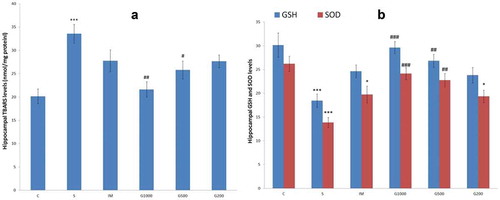
Figure 6. TBARS (a), GSH, and SOD (b) levels in the hippocampus following chronic administration of GOEE and imipramine for 3 weeks