Figures & data
Figure 1. Inflow and outflow boundary condition (a) Original recycle boundary condition, (b) Developed recycle boundary condition (c) Bounce solid boundary condition.
Figure 2. Interfacial boundary and velocity in MPS method.
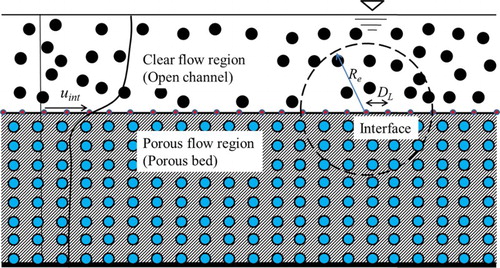
Figure 3. Revised prediction-correction MPS algorithm.
Figure 4. Description of MPS computational domain.
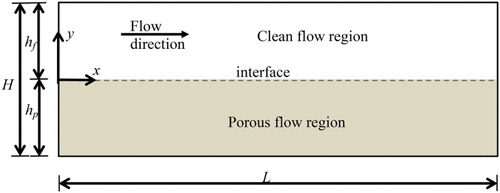
Figure 5. Streamwise velocity comparison of laminar flow over porous bed.
Figure 6. Detailed dimensionless velocity comparison (a) clear flow region (b) porous flow region.
Figure 7. Streamwise velocity comparison of turbulent channel flow over porous bed.
Figure 8. Dimensionless mean-streamwise-velocity comparison (a) Both clear flow region and porous flow region, (b) Enlarged porous flow region.
Figure 9. Configuration of channel flow over a rigid box on porous bed.
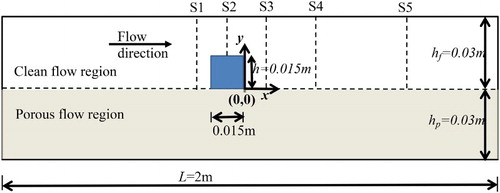
Figure 10. Streamwise velocity comparison. Group A, Ref = 1000.
Figure 11. Streamwise velocity comparison. Group A, Ref = 10000.
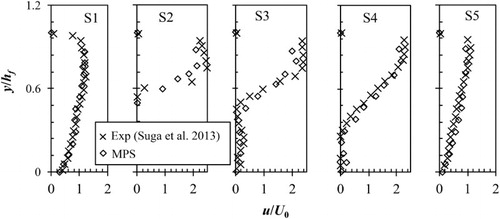
Figure 12. Streamwise velocity comparison. Group B, Ref = 1000.
Figure 13. Streamwise velocity comparison. Group B, Ref = 10000.
Figure 14. Configuration of open channel flow over a cylinder on porous bed.
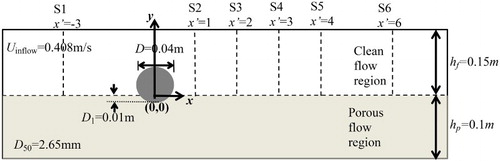
Figure 15. Velocity comparisons between experimental data and Macroscopic MPS model.
Figure 16. Dimensionless interfacial velocity comparison.
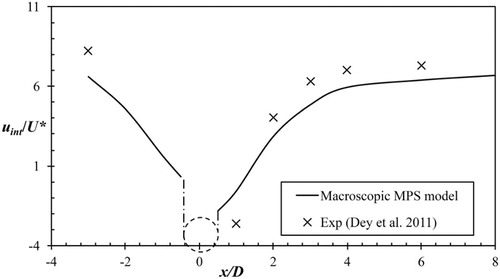
Figure 17. Dimensionless comparison (a) location of velocity defect, (b) variations of peak velocity defect.