Figures & data
Figure 1. Sketches showing the principles of the hydraulic retarder: (a) structure; (b) energy flow.
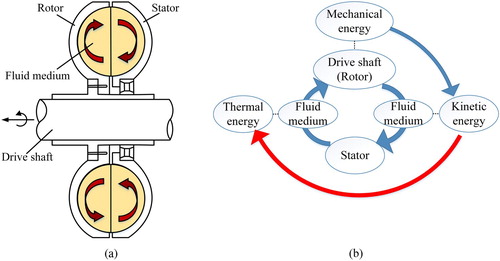
Figure 2. Hydraulic retarder flow passage model: (a) full flow; (b) periodic flow.
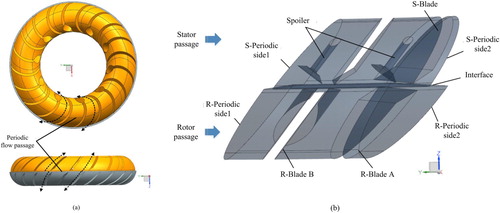
Figure 3. Section structure views of the bionic unit: (a) pit section; (b) groove section.
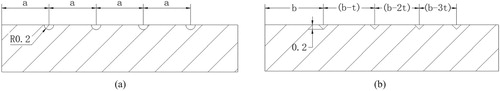
Figure 4. Distributions of bionic units: (a) Model A; (b) Model B; (c) Model C.
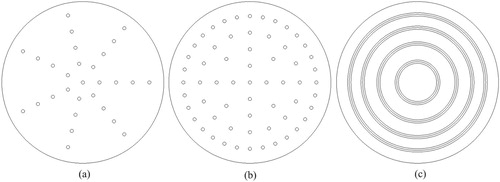
Figure 5. Structure of the boundary layer.
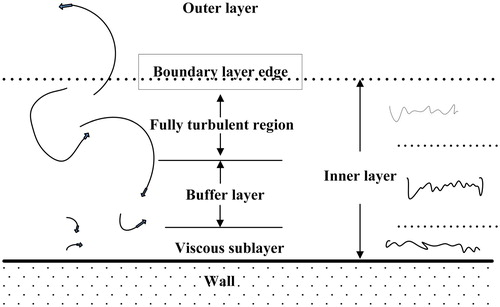
Figure 6. Mesh distribution of the boundary layer.
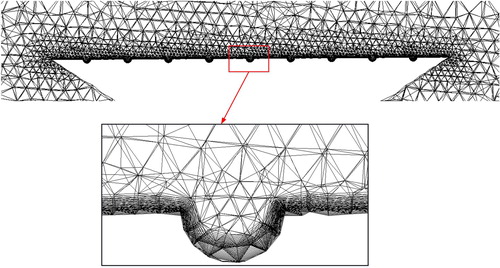
Figure 7. Idling power loss inhibition effects on external characteristics: (a) idling torques of contrast models; (b) torque reduction ratios of contrast models.
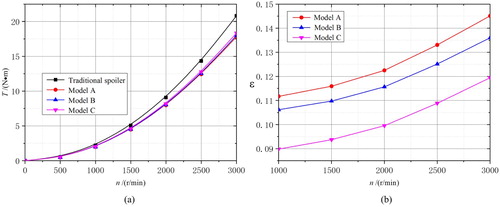
Figure 8. Velocity vector distribution in stator with the rotor speed fixed to 3000 r/min: (a) with smooth surface spoiler; (b) with bionic surface spoiler.
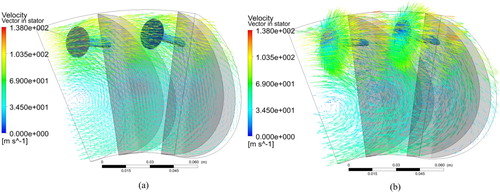
Figure 9. Velocity vector distribution in rotor with the rotor speed fixed to 3000 r/min: (a) with smooth surface spoiler; (b) with bionic surface spoiler.
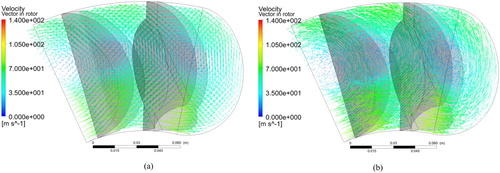
Figure 10. Velocity vector around the surface of the spoiler and enlarged view.
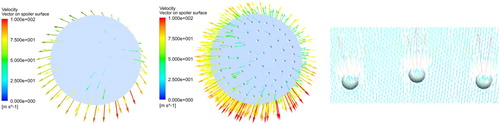
Figure 11. Velocity streamline in flow field: (a) with smooth surface spoiler; (b) with bionic surface spoiler.
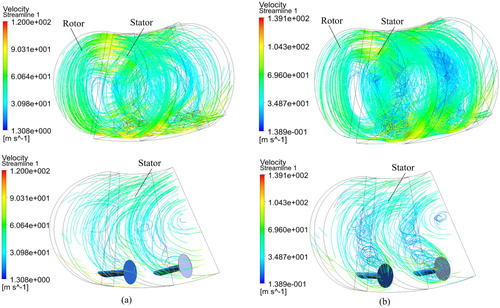
Figure 12. Q-isosurface distribution at vortex core region: (a) with smooth surface spoiler; (b) with bionic surface spoiler.
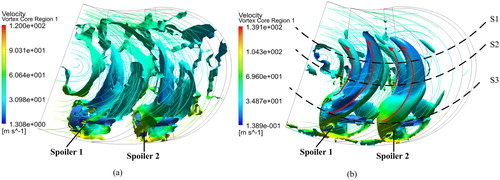
Figure 13. Turbulence eddy dissipation distribution on sections of different radius: (a) section 1; (b) section 2; (c) section 3.
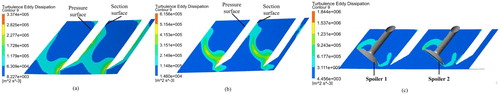
Figure 14. Power loss distribution per unit volume of fluid on sections of different radius: (a) section 1; (b) section 2; (c) section 3.
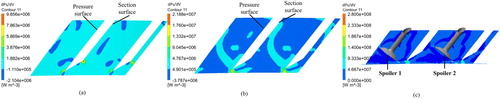
Figure 15. Wall shear stress distribution on spoilers: (a) without bionic structure; (b) with bionic structure.
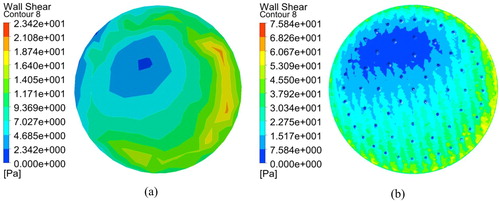
Figure 16. Wall shear stress distribution on the blade pressure surface with smooth surface spoiler: (a) rotor blade 1; (b) rotor blade 2; (c) stator blade.
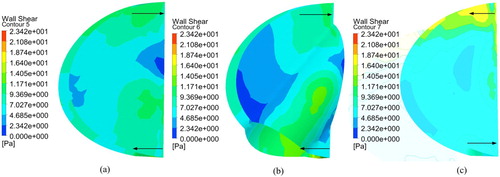
Figure 17. Wall shear stress distribution on the blade pressure surface with bionic surface spoiler: (a) rotor blade 1; (b) rotor blade 2; (c) stator blade.
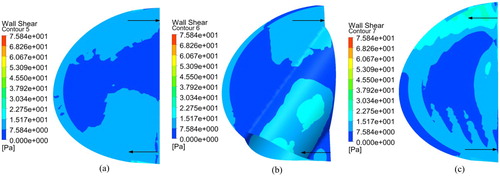
Figure 18. Pressure distribution on the spoiler: (a) without bionic structure; (b) with bionic structure.
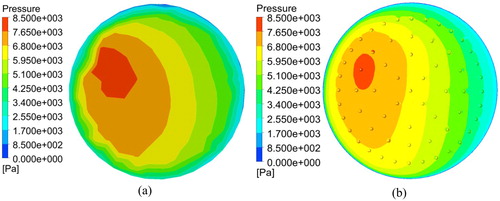
Figure 19. Pressure distribution of rotor blades with smooth surface spoiler: (a) rotor blade 1; (b) rotor blade 2.
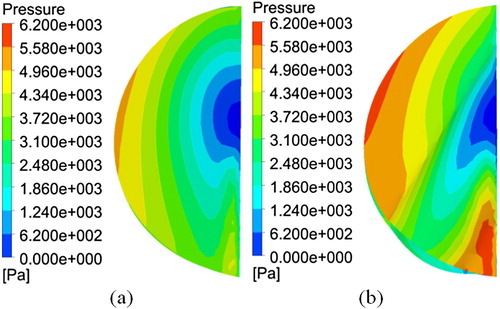
Figure 20. Pressure distribution of rotor blades with bionic surface spoiler: (a) rotor blade 1; (b) rotor blade 2.
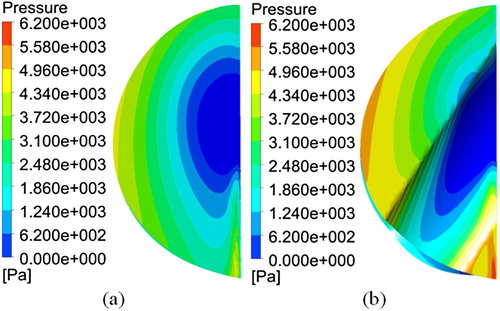
Figure 21. Hydraulic retarder transmission test bench.
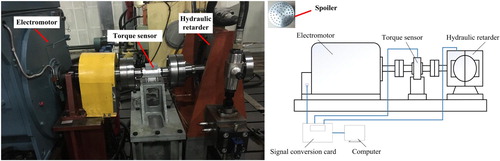
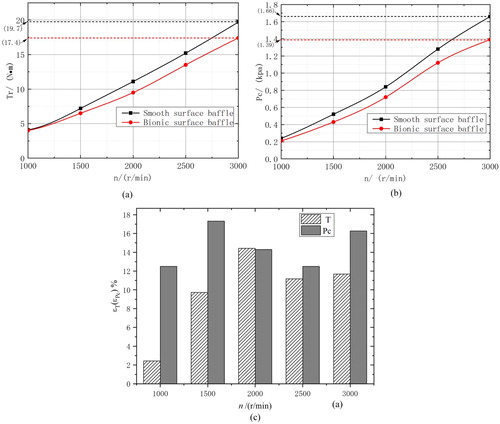
Figure 22. Test results at different rotational speeds: (a) idling torque; (b) chamber pressure; (c) difference percentage of torque and pressure.