
Figures & data
Figure 1. Geometric shapes of class and shape transformation (CST) method. (a) Class function; (b) Shape function
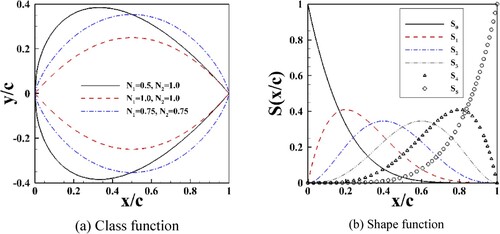
Table 1. Convergence of the aerodynamic performance of the mesh for the RAE2822 airfoil.
Figure 2. Computational grid for the RAE2822 airfoil. (a) Global grid; (b) Local grid
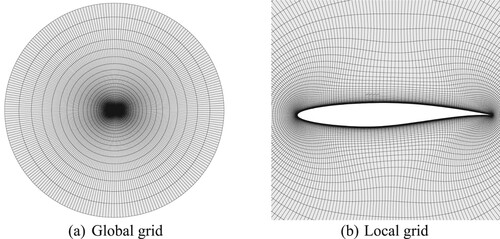
Figure 3. Process of ISOMAP, and comparison of feature extraction.
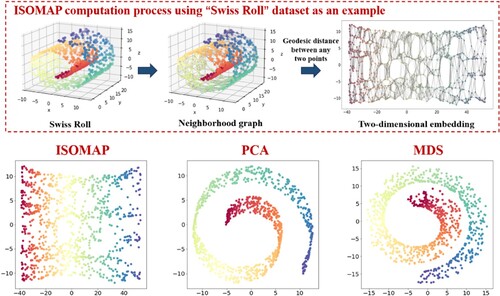
Figure 4. Correlation between features and geometric parameters.
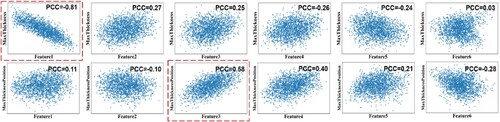
Figure 5. Variation of correlation and time with value.
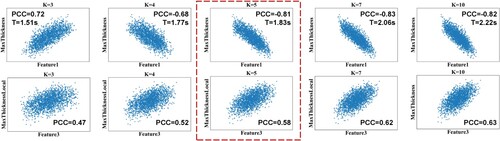
Figure 6. Extracting features of the airfoil by using ISOMAP. (a) Visualization of the feature space; (b) Shape of the airfoil
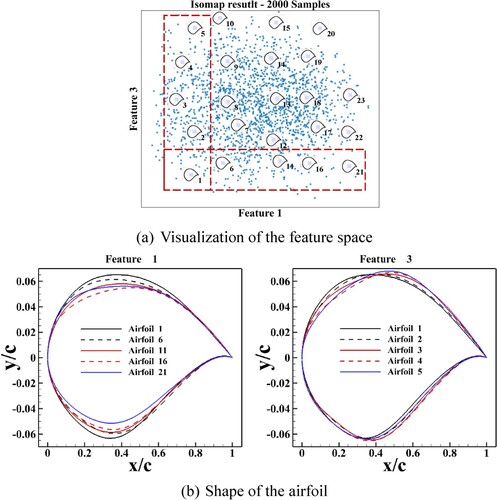
Figure 7. Visualization of geometric features and distributed forces. (a) Airfoils and the distribution of their pressure coefficients; (b) Contours of the pressure coefficient
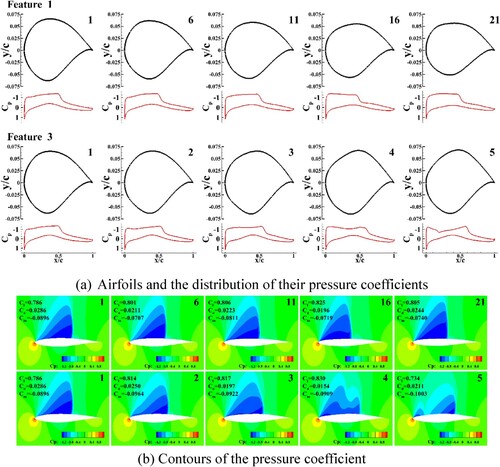
Figure 8. Visualization of integrated forces in the feature space. (a) Mapping of and the probability distribution of
samples; (b) Mapping of
and the probability distribution of
samples; (c) Mapping of
and the probability distribution of
samples
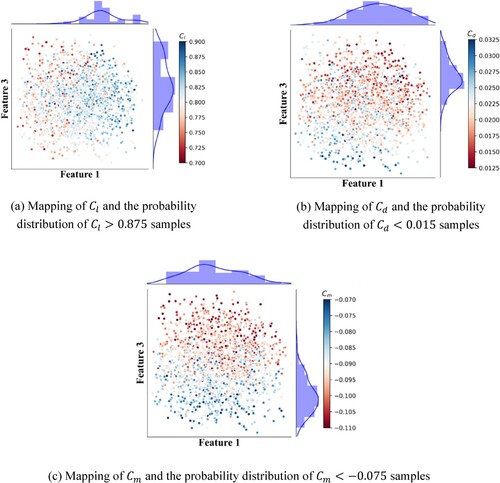
Figure 9. Overall framework for the optimization of the aerodynamic shape of the airfoils by using geometric feature filtering.
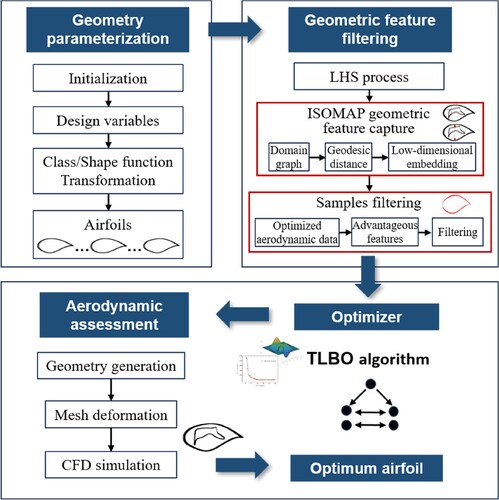
Figure 10. Detailed process of optimization of the aerodynamic shape of the airfoil.
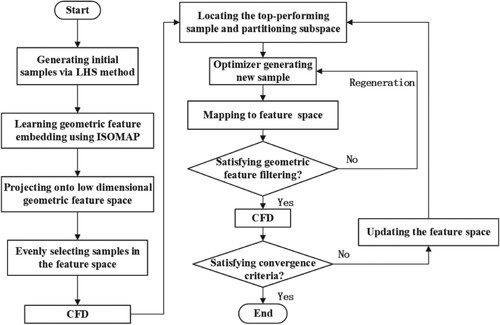
Figure 11. Uniform initial sampling method for feature space
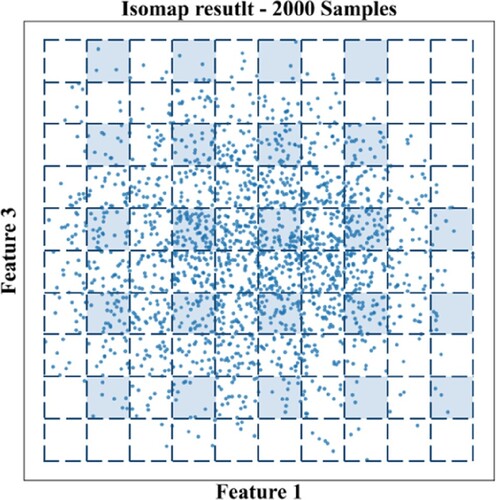
Figure 12. The process of screening samples using geometric features
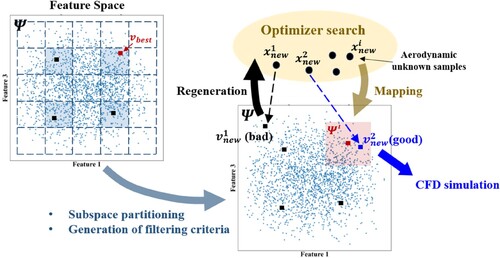
Figure 13. Convergence histories
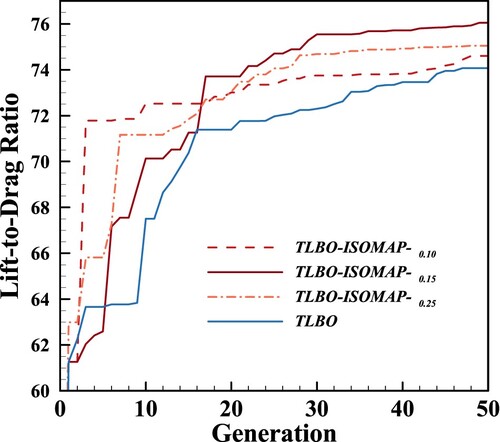
Figure 14. Comparison of the results of unconstrained optimization. (a) Comparison of optimized and initial airfoils; (b) Comparison of the distributions of wall pressure between the optimized and initial airfoils
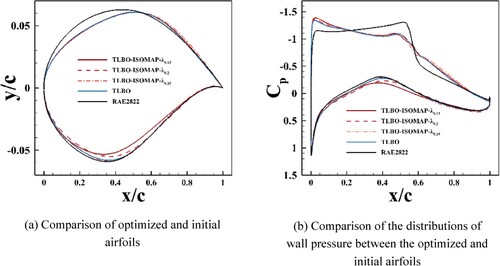
Figure 15. Results of optimized feature projection by TLBO-ISOMAP- and TLBO. (a) First generation of optimization by TLBO-ISOMAP-
(b) First generation of optimization by TLBO; (c) 10th generation of optimization by TLBO-ISOMAP-
; (d) 10th generation of optimization by TLBO; (e) 30th generation of optimization by TLBO-ISOMAP-
; (f) 30th generation of optimization by TLBO; (g)
0th generation of optimization by TLBO-ISOMAP-
; (h) 50th generation of optimization by TLBO
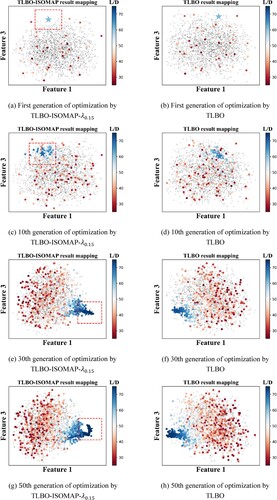
Table 2. Optimization problem statement
Table 3. Result of different constrained optimization
Figure 16. Convergence histories. (a) Case 1; (b) Case 2; (c) Case 3
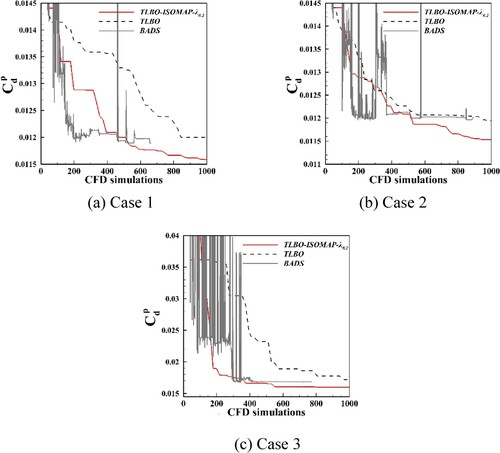
Figure 17. Pressure distributions and airfoils of different constrained optimization. (a) Case 1; (b) Case 2; (c) Case 3
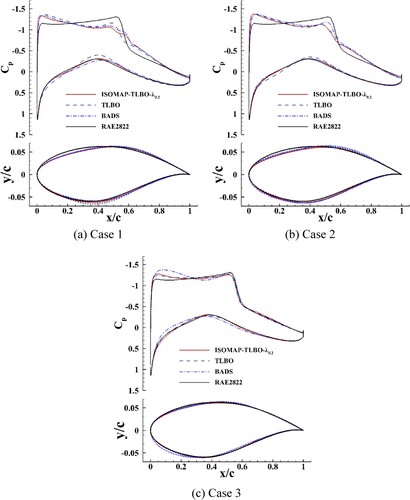
Figure 18. Projections of the top 40% of the samples in terms of aerodynamic performance in case 1. (a) Projection of the sample generated by TLBO-ISOMAP-; (b) Projection of the sample generated by TLBO
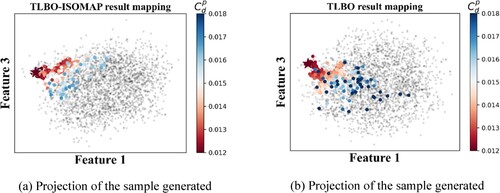
Figure 19. Distribution density of samples generated in generations 30–50 for case 1. (a) TLBO-ISOMAP-; (b) TLBO
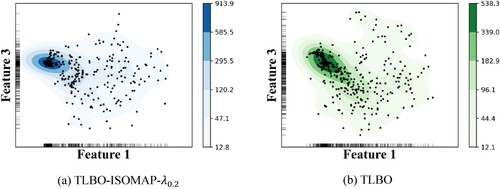
Figure 20. Projection of of samples generated in generations 30–50 for case 1. (a) TLBO-ISOMAP-
; (b) TLBO
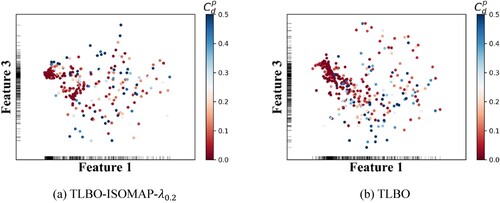
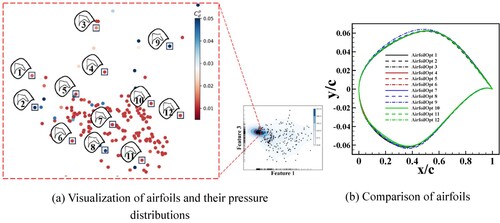
Figure 21. Visualization of the local feature space of samples generated by TLBO-ISOMAP- in generations 30–50 for case 1. (a) Visualization of airfoils and their pressure distributions; (b) Comparison of airfoils
Data availability
Data will be made available on request.