
Figures & data
Figure 1. Proposed metabolic pathways for use of glutamate and aspartate in P. gingivalis based on previously described pathways [Citation8,Citation9,Citation67,6Citation8]. Broken lines indicate expected pathways that were not supported by the experimental evidence.
![Figure 1. Proposed metabolic pathways for use of glutamate and aspartate in P. gingivalis based on previously described pathways [Citation8,Citation9,Citation67,6Citation8]. Broken lines indicate expected pathways that were not supported by the experimental evidence.](/cms/asset/f39a5488-27d4-4a4b-985b-e5c6e4bbde58/zjom_a_1588086_f0001_b.gif)
Table 1. Bacterial strains and plasmids used.
Table 2. Statistics for X-ray diffraction data and crystallographic refinement of PgPta and PgAck.
Figure 2. Purification and gel filtration analysis of recombinant PgPta and PgAck proteins. (a) SDS-PAGE analysis of recombinant PgPta and PgAck proteins. Samples (~5 μg) were subjected to SDS-PAGE and visualized by Coomassie Brilliant Blue staining. The positions of molecular mass markers (in kDa) are shown. (b and c) Gel filtration chromatography analysis of the molecular mass of PgPta (b) and PgAck (c). A calibration curve was constructed using protein standards (shown as open circles in the inset). Purified PgPta and PgAck are represented by closed circles.
Table 3. Kinetic parameters for reactions catalyzed by recombinant PgPta and PgAck.
Figure 3. Enzymatic characterization of recombinant PgPta protein. (a) Effect of pH on AcP production by PgPta. The decrease in acetyl-CoA during incubation of recombinant PgPta with acetyl-CoA at pH 6.0–10.0 was spectrophotometrically quantified by measuring the absorbance at 233 nm (A233). Enzyme activities are indicated relative to the activity at pH 9.0. (b) Steady-state kinetic analysis of PgPta. Reaction mixtures contained 100 mM Tris/phosphate buffer (pH 9.0), 20 mM KCl, 1.8 ng/mL recombinant PgPta, and 50, 75, 100, 125, 150, or 200 µM acetyl-CoA. Averages from three independent experiments are presented.
Figure 4. Enzymatic characterization of recombinant PgAck protein. (a) Effect of pH on production of ATP by PgAcK from 0.3 mM AcP and 0.3 mM ADP. Enzyme activities are indicated relative to the activity at pH 8.0. (b) Effect of divalent metal ions on ATP production by PgAcK from 0.3 mM AcP and 0.3 mM ADP. Enzyme activities at pH 8.0 are indicated relative to that in the presence of 1.3 mM MnCl2. (c) Steady-state kinetic analysis of PgAck using double reciprocal plots from initial velocity measurements determined in 50 mM Tris/HCl buffer (pH 8.0) at 37°C. Various concentrations of AcP (0.0667, 0.133, 0.267, and 0.667 mM) were tested for every fixed ADP concentration (0.267, 0.667, 1.33, and 2.67 mM). Averages from three independent experiments are presented. (d) Secondary plots of the y intercept (velocity reciprocal) vs. the inverse concentration of ADP. (e) Secondary plots of reciprocal slopes from panel (a) vs. the inverse concentration of ADP.
Figure 5. Structural analysis of PgPta. (a) The dimeric structure of PgPta in complex with acetyl-CoA. The two domains of one subunit of the dimer are colored light blue (domain I) and green (domain II), and both domains of the other subunit are colored dark gray. Bound acetyl-CoA molecules are shown as spheres. The 2-fold axis is indicated by arrows. (b) The subunit structure of PgPta viewed in the same orientation as (a). Residues mutated in this study (labeled with bold letters) and bound to acetyl-CoA (Lys92) are shown in ball-and-stick representation. The gray-colored region at the domain interface is a putative active site. (c) Enzyme activity of WT and mutant PgPta proteins. Initial acetyl-CoA consumption velocities were measured, and enzyme activities are indicated relative to that of WT PgPta. Data are presented as means ± standard deviation of three independent experiments (*p < 0.01).
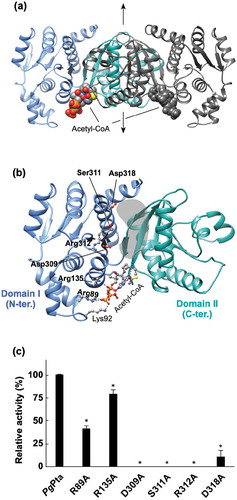
Figure 6. Structural analysis of PgAck. (a) The dimeric structure of PgAck (shown using subunits C and D). The two domains in subunit D are colored pink (N-terminal domain) and purple (C-terminal domain), and both domains of subunit C are colored dark gray. The two sulfate ions (SO42- 401 and 402) bound in the cleft in subunit D, and Pro37 at the edge of the cleft in both subunits, are shown as spheres. The 2-fold axis is indicated by arrows. (b) The subunit structure of PgAck viewed in the same orientation as (a). Residues mutated in this study (labeled with bold letters), with hydrogen-bonding interactions between the domains, and with bound sulfate ions are shown in ball-and-stick representation. Hydrogen bonds are indicated by dashed lines. An enlarged view of the active site is shown in the inset. (c) Superposition of PgAck subunits using Cα atoms of the C-terminal domain (rmsd <0.35 Å, ~234 Cα atoms). The position of the N-terminal domain relative to the C-terminal domain is different among the subunits. Subunits A, C, and D are colored yellow, light green, and blue, respectively. Although subunit B is slightly more similar in conformation to subunit A, it is not shown to simplify the figure. The two sulfate ions bound to subunit D are also illustrated. (d) Enzyme activity of WT and mutant PgAck enzymes. Initial ATP production velocities were measured, and enzyme activities are indicated relative to that of WT PgAck. Data are presented as means ± standard deviation of three independent experiments (*p < 0.01).
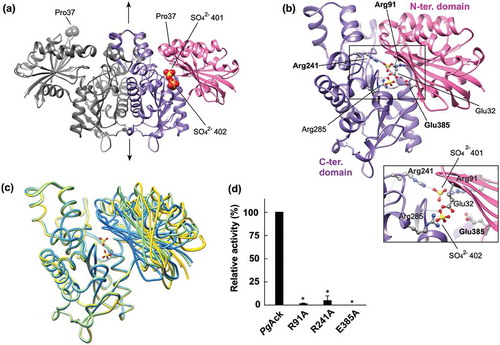
Figure 7. Genetic organization and transcriptional analysis of the pta-ack region of P. gingivalis ATCC 33277. (a) Gene arrangement within the pta-ack region of P. gingivalis ATCC 33277 chromosomal DNA. Large and small arrows indicate open reading frames and RT-PCR primers, respectively. (b) RT-PCR analysis of pta and ack gene expression. PCR amplicons were separated by 0.8% agarose gel electrophoresis. The predicted size (in bp) of each PCR amplicon is shown in parentheses. Lanes marked (+) or (–) indicate standard RT-PCR reactions or negative controls without cDNA, respectively. The positions of DNA size standards (in kb) are indicated on the left.
Table 4. P. gingivalis transformation efficiency.