Figures & data
Figure 1. Microhabitat sample locations in the paediatric oral cavity. Separate swabs were rotated clockwise 6 times at each location to collect oral samples
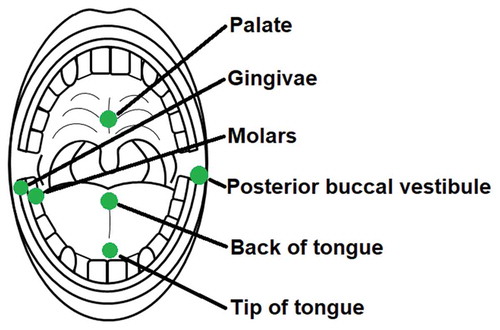
Figure 2. Flow cytometric identification of bacterial and virus-like particle (VLP) populations. Representative cytograms from one participant showing the bacterial and VLP populations at (a) the tip of the tongue before sleep (b) the tip of the tongue after sleep (c) the back of the tongue before sleep and (d) the back of the tongue after sleep. Bacterial and VLP abundances increased after sleep. Differences in bacterial and VLP abundances can also be seen between both sample locations
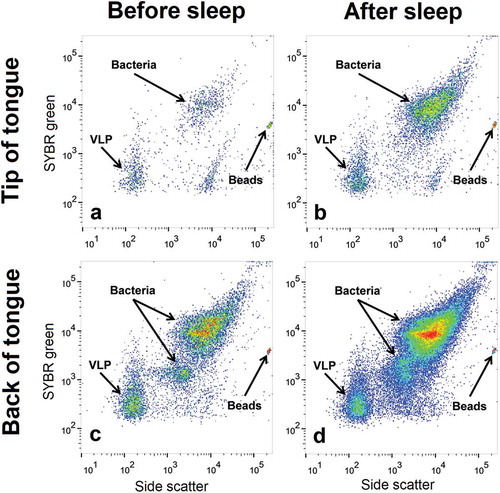
Table 1. Mean (±SEM) bacterial abundances within the paediatric oral cavity before and after sleep compared using Wilcoxon sign rank test. Error represents the standard error of the mean (SEM). Wilcoxon sign rank tests p values were corrected for false discovery rates
Table 2. Mean VLP abundances within the paediatric oral cavity before and after sleep compared using Wilcoxon sign rank test. Error represents the standard error of the mean (SEM). Wilcoxon sign rank tests p values were corrected for false discovery rates
Figure 3. Mann-Whitney U tests for bacterial heterogeneity in the oral cavity before and after sleep. Significant differences between locations are represented by the solid black lines (p < 0.05). Non-significant differences are represented by the dashed black lines (p > 0.05). Mann-Whitney U test comparisons have been corrected for false discovery rates
Figure 4. Mann-Whitney U tests for VLP heterogeneity in the oral cavity before and after sleep. Significant differences between locations are represented by the solid black lines (p < 0.05). Non-significant differences are represented by the dashed black lines (p > 0.05). Mann-Whitney U test comparisons have been corrected for false discovery rates
Figure 5. Heat maps showing the average increase in bacteria and VLP after sleep at sampled locations. All sampled oral locations significantly increased in bacteria and VLP during sleep (p < 0.05). The back of the tongue was the location that increased the most in both bacteria and VLPs during sleep with counts of 1.1 ± 0.2 × 10⁸ and 7.0 ± 4.7 × 10⁷ respectively. The palate increased the least in both bacteria and VLP with counts of 3.6 ± 1.4 × 10⁶ and 1.2 ± 1.0 × 10⁷ respectively
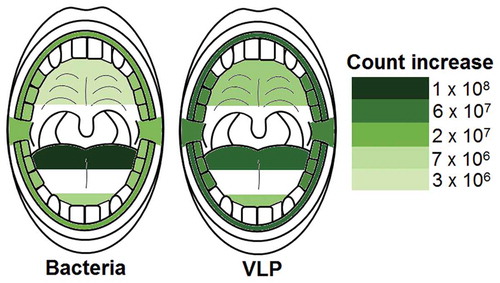
Figure 6. Heat maps showing the average percentage increase in bacteria and VLP after sleep at sampled locations. The molars, back of the tongue and gingiva were the locations with the lowest bacterial percentage increase during sleep (714%, 764% and 784% respectively). Likewise, the back of the tongue also had the lowest VLP percentage increase (416%). The tip of the tongue was the area with the highest bacterial percentage increase (2391%) and the posterior buccal vestibule the highest VLP percentage increase (3638%)
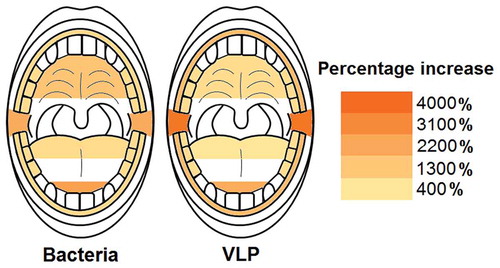
Figure 7. Pearson correlation coefficient bacterial abundance networks (p < 0.05 filtered). Networks show the Pearson correlations between bacterial abundances for all samples locations (a) before sleep and (b) after sleep. Each node (circles) represents a sample location within the paediatric oral cavity. Node size is proportional to bacterial abundance at that location. The edges (lines) connecting each node represent a significant Pearson correlation (p < 0.05) in bacterial abundances between oral sites. The thickness of the edge relates to the strength of the Pearson correlation coefficient. B-GING = bacteria at the gingiva, B-PBV = bacteria at the posterior buccal vestibule, B-PALATE = bacteria at the palate, B-MOLARS = bacteria at the molars, B-TTONGUE = bacteria at the tip of the tongue and B-BTONGUE = bacteria at the back of the tongue
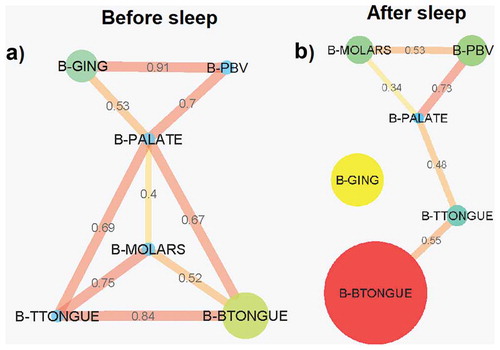
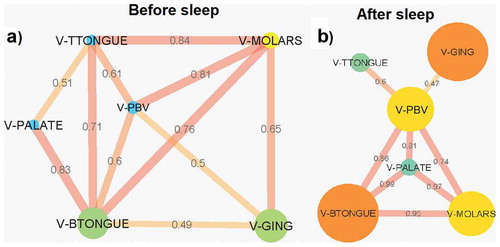
Figure 8. Pearson correlation coefficient VLP abundance networks (p < 0.05 filtered). Networks show the Pearson correlations between VLP abundances for all samples locations (a) before sleep and (b) after sleep. Each node (circles) represents a sample location within the paediatric oral cavity. Node size is proportional to VLP abundance at that location. The edges (lines) connecting each node represent a significant Pearson correlation (p < 0.05) in VLP abundances between oral sites. The thickness of the edge relates to the strength of the Pearson correlation coefficient. V-GING = VLP at the gingiva, V-PBV = VLP at the posterior buccal vestibule, V-PALATE = VLP at the palate, V-MOLARS = VLP at the molars, V-TTONGUE = VLP at the tip of the tongue and V-BTONGUE = VLP at the back of the tongue