Figures & data
Table 1. Demographic and clinical characteristics of study population.
Figure 1. Carbon source utilization by dental plaque in the caries-free (●) and S-ECC (Δ) groups. (a) Average well color development (AWCD) with incubation time in the two groups. (b–d) Catabolic kinetics based on incubation time of sucrose (D11), α-D-Lactose (C4), and L-Phenylalanine (H2) in the caries-free and S-ECC groups. * P < 0.05 and ** P < 0.01 by the Mann–Whitney U test.
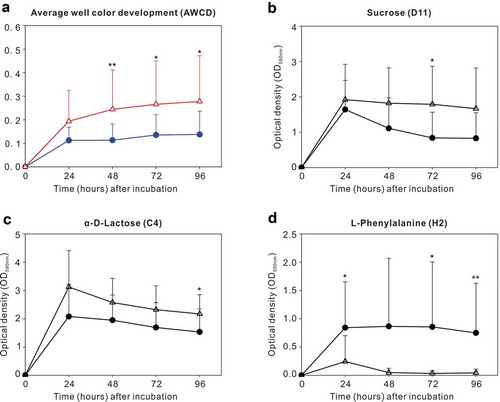
Figure 2. Microbial communities of caries-free (CF) and S-ECC in original plaques before being cultured. (a) A principal coordinate analysis (PCoA) based on the weighted UniFrac distances. (b) The weighted UniFrac distance values of the CF and S-ECC groups. All data are presented as medians and the 10th, 25th, 75th, and 90th percentiles. **P < 0.01 as assess by the nonparametric method Adonis (n = 999). (c) Microbial indicators for classification of S-ECC status. The 11 most discriminatory species were identified by applying Random Forest models of their relative abundances in the original plaque between the CF and S-ECC groups. Species are shown in ascending order of their importance to the accuracy of the model. Importance was determined based on the Mean Decrease Accuracy (left) produced by the ‘randomForest’ package in R (v3.4.0). The inset of the left part shows the misclassification/error rate as a function of the number of input species. The right part shows the log10-transformed relative abundances of the 11 most discriminatory species in the CF (blue) and S-ECC (red) groups.
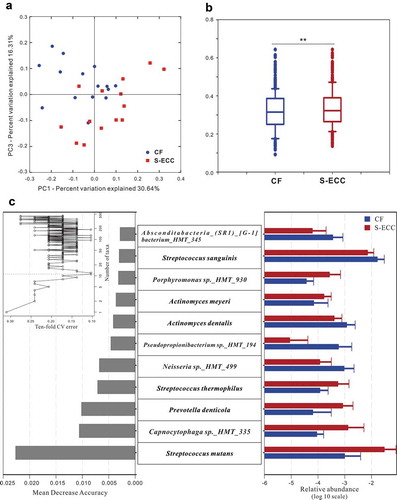
Table 2. Alpha diversity comparison between original plaque (O) and well A1 (P values of the Wilcoxon test).
Table 3. Pairwise Adonis analysis for significant differences in beta diversity measures (weighted UniFrac distance) among the different groups of original plaque (O), D11, and C4 plaque samplesa.
Figure 3. Microbial communities of CF and S-ECC plaques before and after sucrose and lactose consumption. Neighbor-joining phylogeny based on pairwise Adonis components for beta diversity. Branch lengths represent the degrees to which the bacterial communities are differentiated. Groups shaded in green showed no significant differences in beta diversity values. CF, caries-free children; S-ECC, severe early childhood caries. O, original aliquot of plaque before Biolog analysis; D11, sucrose; C4, α-D-Lactose.
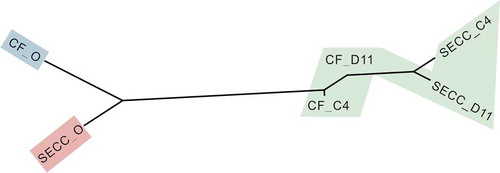
Figure 4. Alpha and beta diversity of microbial communities when using water, sucrose, α-D-Lactose, and L-Phenylalanine as the sole carbon source. Boxplots of Shannon indices (alpha diversity estimator) in the CF (a) and S-ECC (b) groups. All data are presented as medians and the 10th, 25th, 75th, and 90th percentiles. ** P < 0.01 as assessed using the post hoc analysis for the Friedman test in SPSS (v 20). A principal coordinate analysis (PCoA) of beta diversity based on the weighted UniFrac distance values in the CF (c) and S-ECC (d) groups.
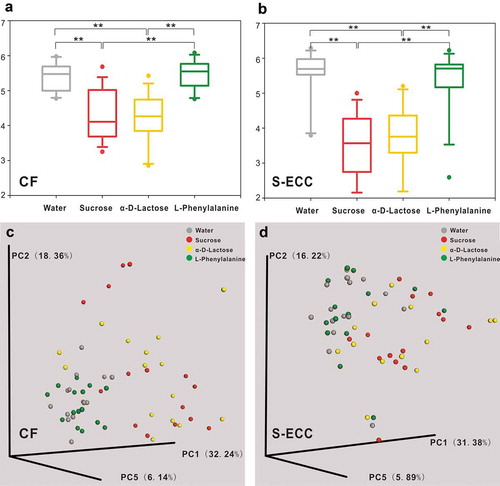
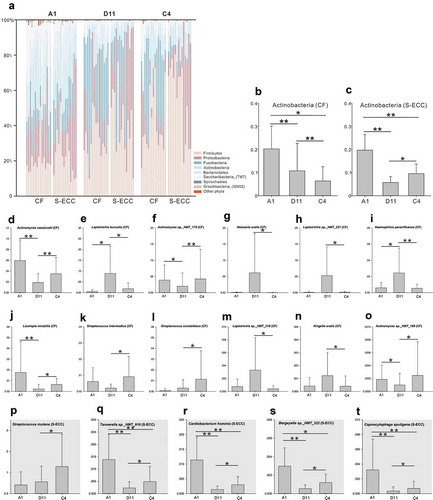
Figure 5. Microbial communities of lactose and sucrose. (a). Relative abundances of the resident bacterial phyla under different carbon sources. (b, c). Differently abundant phylum Actinobacteria between sucrose and α-D-Lactose in the CF and S-ECC groups. (d–o) Differently abundant species between sucrose and α-D-Lactose in the CF group. (p–t) Differently abundant species between sucrose and α-D-Lactose in the S-ECC group. Species are listed in descending order according to the mean relative abundance of A1, D11, and C4. Bars indicate mean relative abundances with standard deviations. The significance of the differences among the groups was determined using the Friedman test. Post hoc analysis with Wilcoxon signed-rank tests was conducted with a Bonferroni correction applied. *P < 0.05, **P < 0.01.