Figures & data
Figure 1. (a) Box plot illustrating microbial diversities between the three groups. No difference in alpha diversity was detected between the groups. (b) Distribution of bacterial communities across three groups at the phylum level. (c) Distribution of bacterial communities across three groups at the genus level
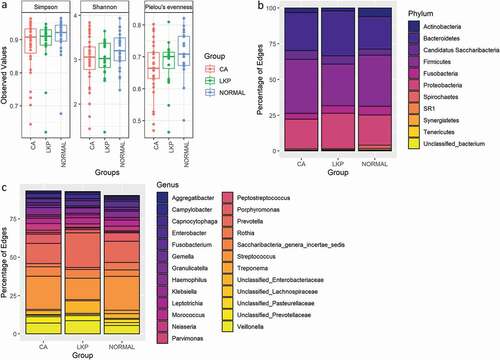
Figure 2. sPLS-DA plot based on the relative abundance of bacterial genera in WMF from patients in normal, LKP, and CA groups
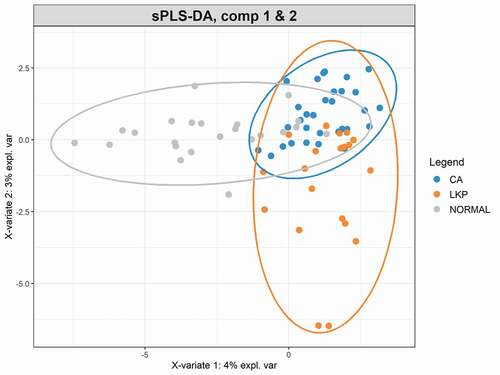
Figure 3. Box plots of the top 10 discriminative taxa based on the variable importance scores
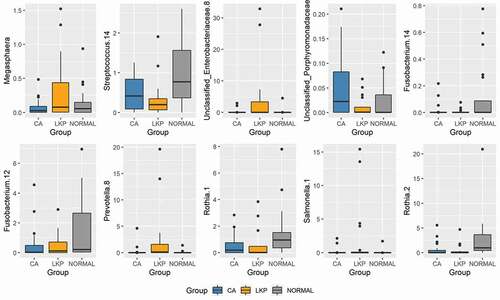
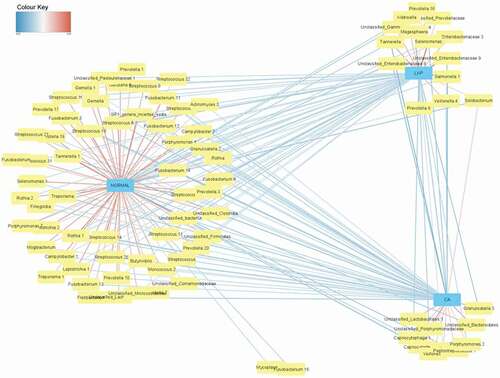
Figure 4. Network matrix of discriminant bacterial genera in healthy control groups identified by sparse partial least square regression (sPLS-DA). The network is displayed graphically as lines; the colour of line indicating the association level