2,097
Views
5
CrossRef citations to date
0
Altmetric
Original Article

Trends in the study of Modern languages in Swedish lower secondary school (2000 – 2018) and the impact of grade point average enhancement credits

ORCID Icon, &

Figures & data

Figure 1. Proportions of pupils studying a Second Foreign Language in year 9 (2000–2018) – Sweden national average
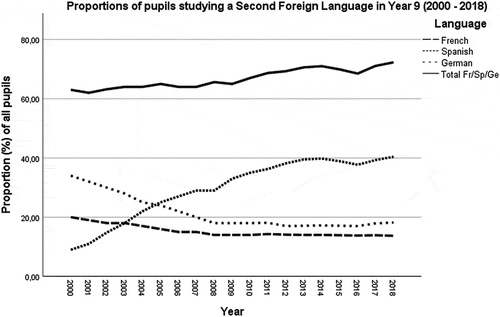
Figure 1. Proportions of pupils studying a Second Foreign Language in year 9 (2000–2018) – Sweden national average

Figure 2. Proportions of pupils studying French/German/Spanish in Sweden and in different municipality groups (means) (2000–2018)
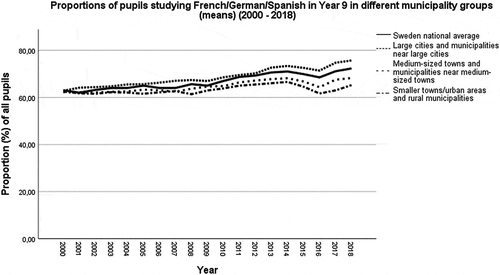
Figure 2. Proportions of pupils studying French/German/Spanish in Sweden and in different municipality groups (means) (2000–2018)

Figure 3. Proportions of pupils studying French in Sweden and in different municipality groups (means) (2000–2018)
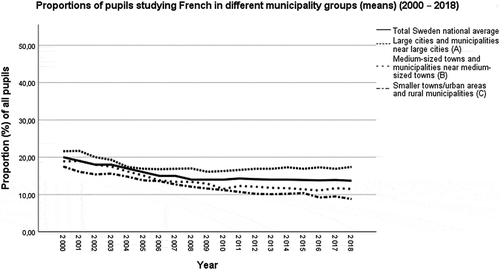
Figure 3. Proportions of pupils studying French in Sweden and in different municipality groups (means) (2000–2018)

Figure 4. Proportions of pupils studying German in Sweden and in different municipality groups (means) (2000–2018)
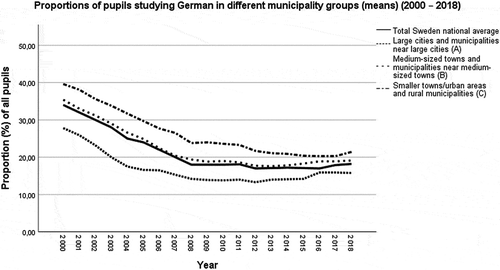
Figure 4. Proportions of pupils studying German in Sweden and in different municipality groups (means) (2000–2018)

Figure 5. Proportions of pupils studying Spanish in Sweden and in different municipality groups (means) (2000–2018)
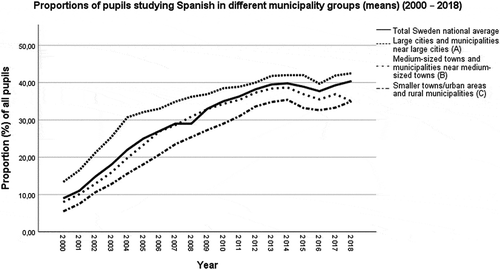
Figure 5. Proportions of pupils studying Spanish in Sweden and in different municipality groups (means) (2000–2018)

Table 1. Number of municipalities without registered pupils in French, German or Spanish (2018)

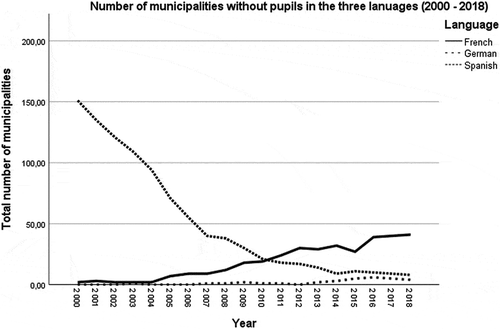
Figure 6. Number of municipalities registering no pupils in the respective languages (2000–2018)

Figure 6. Number of municipalities registering no pupils in the respective languages (2000–2018)

Table 2. β coefficients before (2000–2007) and after (2008–2018) the introduction of GPAEC

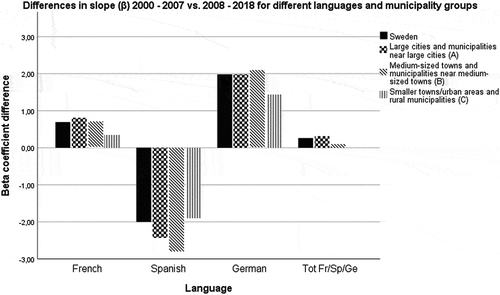
Figure 7. Differences in slopes (2000–2007) vs. (2008–2018) for the three languages and for different municipality groups

Figure 7. Differences in slopes (2000–2007) vs. (2008–2018) for the three languages and for different municipality groups

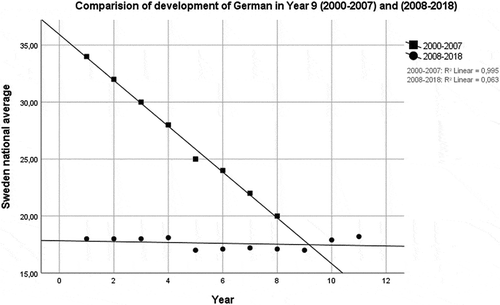
Figure 8. Comparison of trends in the study of German in year 9 (2000–2007) and (2008–2018)

Figure 8. Comparison of trends in the study of German in year 9 (2000–2007) and (2008–2018)