Figures & data
Figure 1. Overview of assessment
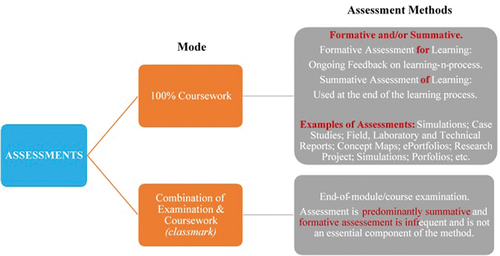
Table 1. Participant gender distribution by age group and race categories.
Table 2. Percentage of undergraduate programme modules using continuous assessment and/or examination in the FoHS.
Table 3. Descriptive statistics.
Table 4. Reliabilities.
Figure 2. Reasons for not using CA
Figure 3. Ways of acquiring knowledge about CA and its practices
Table 5. Factor analysis results.
Figure 4. Reasons for using CA
Figure 5. Conceptual understanding of CA and its practices
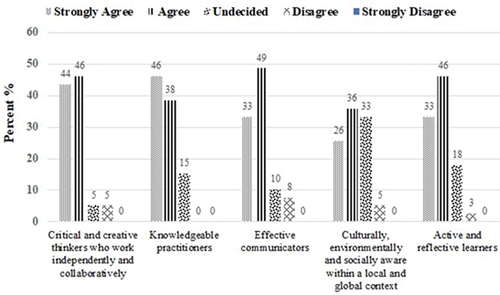
Figure 6. Assessments encouraging graduate attributes