
Figures & data
Table 1. Demographic details of the sample of Syrian and Iraqi refugees.
Table 2. Means and standard deviations for different aspects of posttraumatic growth and different types of posttraumatic stress symptoms for refugees from Syria and Iraq.
Figure 1. Relationship between posttraumatic stress symptoms and posttraumatic growth among Syrian and Iraqi refugees residing in Turkey. Best fitting linear and quadratic relationship presented in blue and red, respectively. Position of individual data points jittered for easier interpretation.
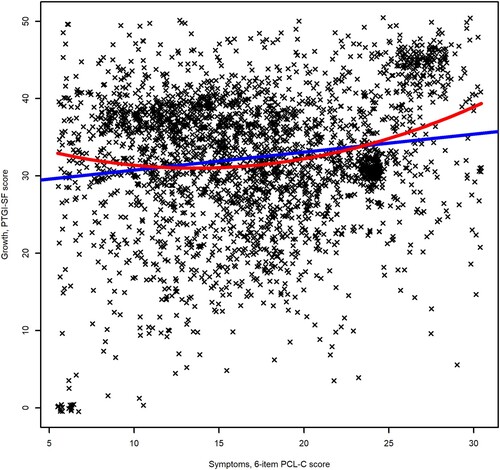
Figure 2. Gaussian graphical models of (a) aspects of posttraumatic growth and (b) aspects of posttraumatic growth (presented in blue) and types of posttraumatic stress symptoms (presented in red), for Syrian and Iraqi refugees residing in Turkey. Edge thickness represents degree of association as partial correlations, green edges indicate positive association, and red edges indicate negative association. Model selection estimation used for estimating the network and the spring algorithm used for layout determination.
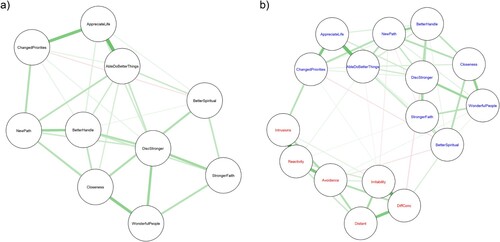
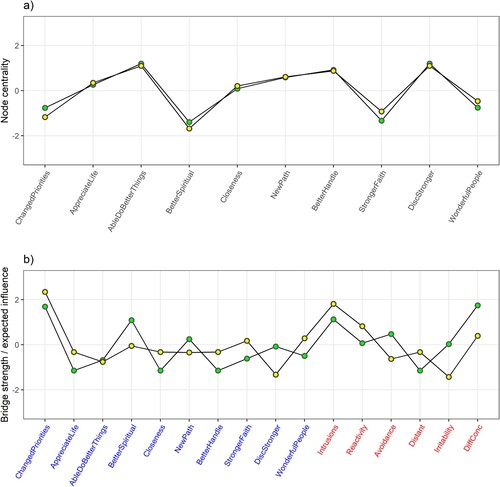
Figure 3. Node/bridge strength (green) and node/bridge 1-step expected influence (yellow) as measures of node/bridge centrality for (a) network of aspects of posttraumatic growth and (b) network of aspects of posttraumatic growth (presented in blue) and types of posttraumatic stress symptoms (presented in red), for Syrian and Iraqi refugees residing in Turkey. Scaled values presented.
Supplemental Material
Download Text (1.6 KB)Supplemental Material
Download Text (1.8 KB)Supplemental Material
Download MS Word (303.1 KB)Supplemental Material
Download MS Word (115.3 KB)Supplemental Material
Download MS Word (503.4 KB)Supplemental Material
Download MS Word (158.5 KB)Supplemental Material
Download Rich Text Format File (299.2 KB)Supplemental Material
Download MS Word (643.9 KB)Supplemental Material
Download MS Word (1.4 MB)Data availability statement
Data used in this research are available from the third author upon request. As permission to share data publicly was not requested from participants and the data includes potentially sensitive information, the data cannot be made fully publicly available. All scripts used to carry out data manipulation and statistical analyses are provided in the Supplementary Material.