
Figures & data
Table 1. Demographics of SORTS respondents.
Table 2. Standardised exploratory factor analysis loadings of a two-factor SORTS model with continuous scores.
Figure 1. Higher-order measurement model of the significant others’ Responses to Trauma Scale with items identified through exploratory factor analysis.
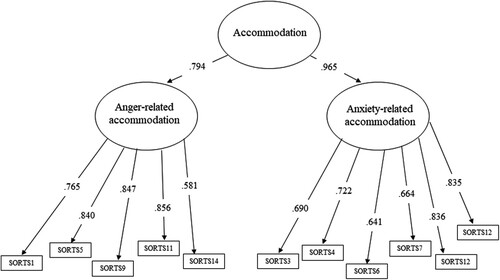
Table 3. Fit statistics for CFA models.
Table 4. Correlations among SORTS Factors, PTSD symptoms rated by IP and FM, and relationship satisfaction.
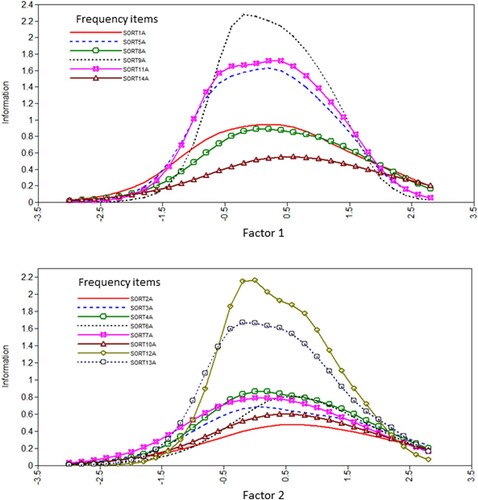
Figure 2. Item information curves (IICs) for individual frequency items from the Significant other’s Responses to Trauma Scale (SORTS) loading onto Factor 1 (anger-related accommodation) and factor (anxiety-related accommodation).
Figure_S2_Slide4.tif
Download TIFF Image (136.1 KB)Supplementary Tables and Figures_revision_with thresholds.pdf
Download PDF (640.1 KB)Figure_S1_Slide2.tif
Download TIFF Image (139.4 KB)Figure_S1_Slide1.tif
Download TIFF Image (145.5 KB)Figure_S2_Slide1.tif
Download TIFF Image (127.8 KB)Figure_S1_Slide5.tif
Download TIFF Image (137.3 KB)Figure_S2_Slide3.TIF
Download TIFF Image (127.4 KB)Figure_S2_Slide8.tif
Download TIFF Image (149.3 KB)Figure_S2_Slide6.tif
Download TIFF Image (136.1 KB)Figure_S2_Slide7.tif
Download TIFF Image (135.5 KB)Figure_S1_Slide3.tif
Download TIFF Image (134.2 KB)Figure_S1_Slide4.tif
Download TIFF Image (131.3 KB)Figure_S2_Slide2.tif
Download TIFF Image (132.1 KB)Supplementary_Tables_and_Figures_revision_no_figures.docx
Download MS Word (30.5 KB)Figure_S2_Slide5.tif
Download TIFF Image (130.4 KB)Figure_S1_Slide6.tif
Download TIFF Image (148.3 KB)Data availability statement
Data used in the present study were aggregated across multiple studies/clinical programmes; as a result of differences in the individual Data Use Agreements that govern this aggregation, the data are not available to outside investigators.