
Figures & data
Table 1. Percentages and frequencies of demographic family factors.
Figure 1. Occurrence (%) of war trauma among mothers and fathers.
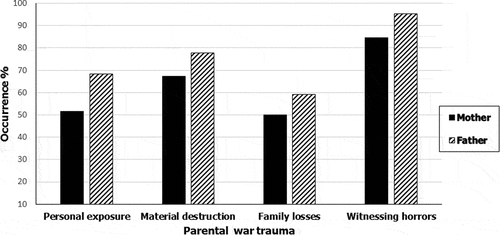
Table 2. Pearson’s product model correlations between family variables of the cluster analysis.
Table 3. Means (M) and standard errors (SE) of parental and child factors according to the family-type cluster membership.
Table 4. Means (M) and standard errors (SE) of children’s mental health and post-traumatic cognitions according to family type.