Figures & data
Figure 1. PRISMA diagram outlining results from the study selection process.
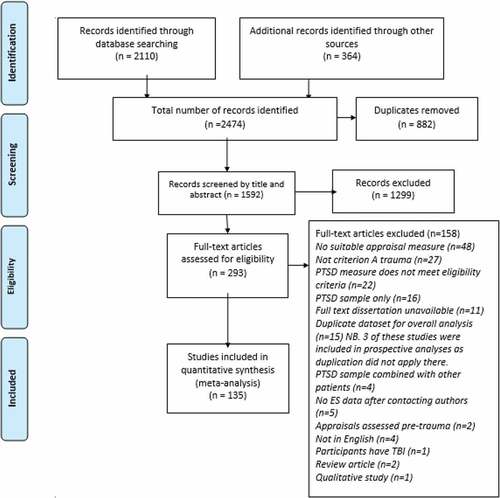
Table 1. Results from overall and subgroup meta-analyses.
Table 2. Table of subgroup analysis and sensitivity analysis results for ptci and cptci studies only.
Figure 2. Forest plot showing effect sizes across different subtypes of maladaptive appraisal.
Figure 3. Forest plot showing effect size of relationship between acute appraisals and PTSD symptoms at 2–4 months, 6 months and 12 months since trauma.
Table 3. Estimates of publication bias for all analyses.
Figure 4. Funnel plot of standard error by Fisher’s Z for overall effect size (all studies included) showing the symmetry of the data in relation to publication bias.
Figure 5. Funnel plot of effect sizes exploring publication bias for meta-analysis of appraisals measured using only PTCI and CPTCI.