
Figures & data
Figure 1. Network of PTSD and depression symptoms in a sample of Filipina domestic workers. Parsimonious network using LASSO estimation is shown. There are 190 non-zero edges (represented by lines linking the symptoms) out of total 378 possible edges.
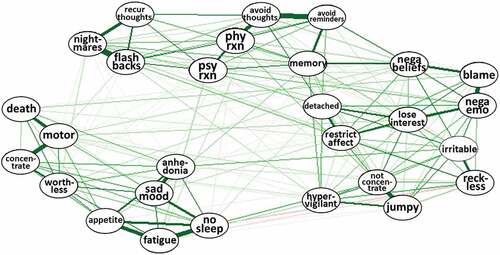
Figure 2. Strength centrality index of the network structure of PTSD and depression symptoms (in standardized z-scores). Nodes with higher strength are represented by higher z-scores.
Figure 3. Bootstrapped difference tests result between node strength. Black boxes represent significant differences between nodes.
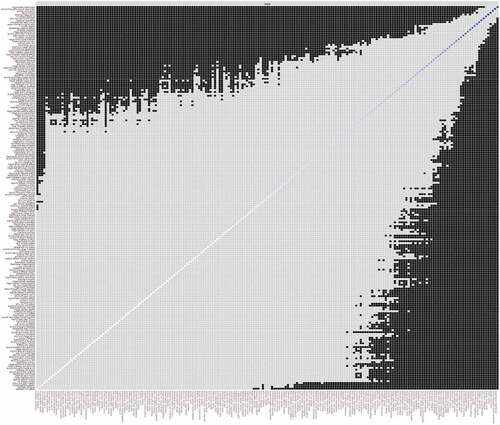
Figure 4. Network of PTSD and depression symptoms showing bridge symptoms in a sample of Filipina domestic workers.
Figure 5. Bridge strength centrality index of the network structure between PTSD and depression symptoms. Bridge symptoms with higher strength are represented by higher z-scores.
Figure 6. Bridge strength centrality index of the network structure between PTSD and depression symptoms. Bridge symptoms with higher strength are represented by higher z-scores.
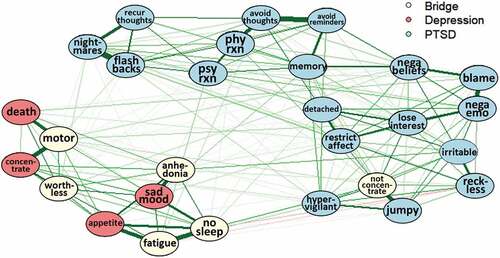
Figure 5. Bridge strength centrality index of the network structure between PTSD and depression symptoms. Bridge symptoms with higher strength are represented by higher z-scores.
Table 1. Item, item content, item abbreviation, means, and standard deviations for PCL-5 and PHQ-9.