2,471
Views
6
CrossRef citations to date
0
Altmetric
Research Article

Does cumulative exposure to traumatic stressors predict treatment outcome of community-implemented exposure-based therapy for PTSD?

创伤应激源的累积暴露是否可以预测社区实施的PTSD暴露疗法的治疗结果?

¿ La exposición acumulada de estresores traumáticos predice el resultado del tratamiento de la terapia de tept basada en la exposición implementada en la comunidad?

, , , , ORCID Icon &
Article: 1789323 | Received 06 Jun 2019, Accepted 16 Jun 2020, Published online: 15 Sep 2020

Figures & data

Figure 1. Participant flow chart.

Figure 1. Participant flow chart.

Table 1. Demographic and clinical information of the sample.

Figure 2. Symptom development following treatment with NET as a function of trauma load. (a): Bee swarm plots of PTSD symptom severity before therapy and at 4 and 10 months following the end of the treatment. The heat colours represent the levels of traumatic load for each individual, ranging from relatively low levels (represented by white circles) to high levels of traumatic load (represented by red circles). The lines of the plot indicate the median PDS Score (marked in bold) at each measurement point and the interquartile range. (b): Mean PDS symptom scores (standard errors) before as well as 4 and 10 months following the end of the treatment are displayed as a function of trauma load. For a better visualization, the sample has been splitted in tertiles.

Figure 2. Symptom development following treatment with NET as a function of trauma load. (a): Bee swarm plots of PTSD symptom severity before therapy and at 4 and 10 months following the end of the treatment. The heat colours represent the levels of traumatic load for each individual, ranging from relatively low levels (represented by white circles) to high levels of traumatic load (represented by red circles). The lines of the plot indicate the median PDS Score (marked in bold) at each measurement point and the interquartile range. (b): Mean PDS symptom scores (standard errors) before as well as 4 and 10 months following the end of the treatment are displayed as a function of trauma load. For a better visualization, the sample has been splitted in tertiles.

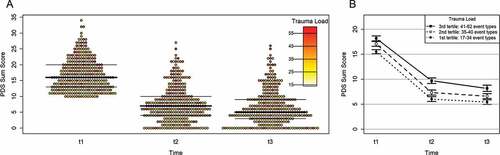
Table 2. Estimated models and model selection procedure.

Figure 3. Scatterplot of PTSD symptom severity before treatment and at the 10 months follow-up as a function of trauma load. The bold line indicates no change in symptom severity following treatment with NET, while individual data points below and above the dashed line indicate clinically significant improvement (shaded in dark grey) and worsening (shaded in light grey), respectively. The heat colours represent the levels of traumatic load for each individual, ranging from relatively low levels (represented by white circles) to high levels of traumatic load (represented by red circles). To avoid overplotting, individual data points with the same values regarding PTSD symptom severity before and after each other have been plotted next to each other.

Figure 3. Scatterplot of PTSD symptom severity before treatment and at the 10 months follow-up as a function of trauma load. The bold line indicates no change in symptom severity following treatment with NET, while individual data points below and above the dashed line indicate clinically significant improvement (shaded in dark grey) and worsening (shaded in light grey), respectively. The heat colours represent the levels of traumatic load for each individual, ranging from relatively low levels (represented by white circles) to high levels of traumatic load (represented by red circles). To avoid overplotting, individual data points with the same values regarding PTSD symptom severity before and after each other have been plotted next to each other.

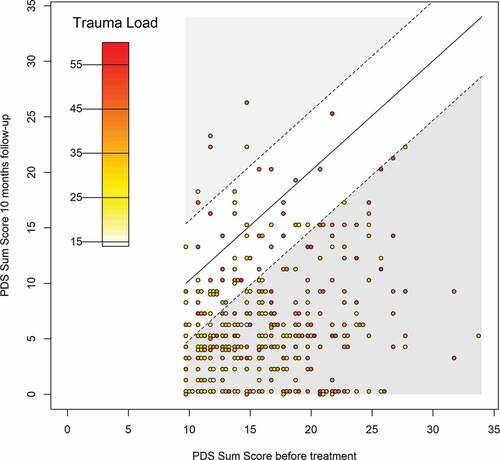
Table 3. Results of linear mixed model for the symptom cluster intrusions, avoidance and hyperarousal.

Supplemental material

Supplemental Material

Download MS Word (31.3 KB)