
Figures & data
Figure 1. Network displaying the interrelationships between ACEs, a wide array of prenatal risk factors for preterm birth and low birthweight, and the outcomes of interest. Carnation nodes represent ACEs, purple nodes represent the outcomes, teal nodes indicate biological risks, blue nodes indicate risky behaviours, orange nodes indicate psychosocial risks, green nodes represent environmental risks, and pink nodes represent covariates. Blue edges suggest positive association while red edges (dashed) represent negative associations. Node predictability measures visualised using node rings, with blue rings indicating the proportion of explained variance for continuous nodes while purple rings indicate accuracy of intercept model for dichotomous nodes. The red rings indicate additional accuracy achieved by all remaining variables.
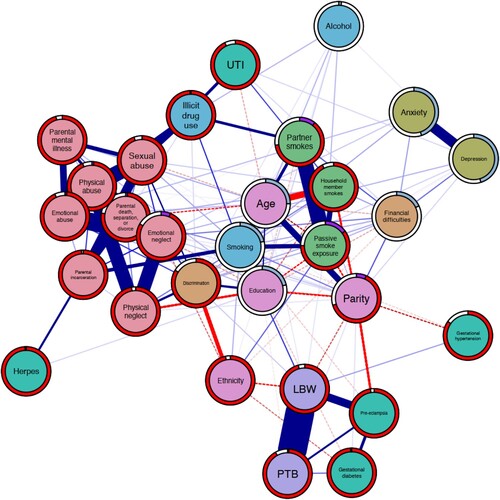
Figure 2. Network displaying the interrelationships between ACEs, a wide array of prenatal risk factors for preterm birth and low birthweight, and the outcomes of interest. Carnation nodes represent ACEs, purple nodes represent the outcomes, teal nodes indicate biological risks, blue nodes indicate risky behaviours, orange nodes indicate psychosocial risks, green nodes represent environmental risks, and pink nodes represent covariates. Blue edges suggest positive association while red edges (dashed) represent negative associations. Node predictability measures visualised using node rings, with blue rings indicating the proportion of explained variance for continuous nodes while purple rings indicate accuracy of intercept model for dichotomous nodes. The red rings indicate additional accuracy achieved by all remaining variables.
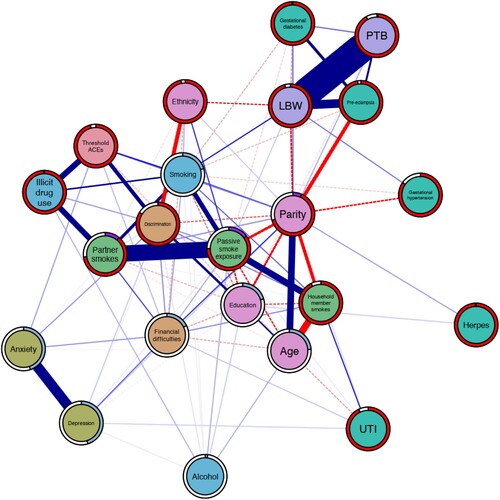
Table 1. Sociodemographic characteristics of the sample (n = 8379).