
Figures & data
Figure 1. Map of Tanzania showing study locations which included four districts (highlighted in green) located within four regions (highlighted in yellow).
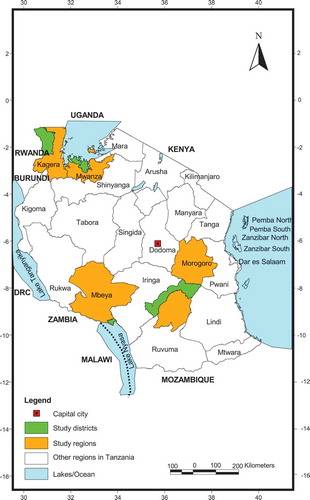
Table 1. Clinical features of febrile patients in Karagwe, Sengerema, Kilombero and Kyela districts of Tanzania.
Table 2. Seroprevalence of anti-CHIKV-IgG among febrile patients in Karagwe, Kilombero, Kyela and Sengerema districts.
Table 3. Comparison between clinical features and demographic characteristics of study participants with acute chikungunya infection in Karagwe, Kilombero, Kyela and Sengerema districts.
Table 4. The proportion of seroprevalence of chikungunya virus infection by age group.