Figures & data
Figure 1. General background of distribution of Borrelia spp. in western Palearctic and the individual sets of clusters used for further analyses. a: The coordinates of records of B. afzelii in questing nymphal I. ricinus as reported in the published literature. b: The coordinates of records of B. garinii in questing nymphal ticks as reported in the published literature. For both a and b, compilation finished in the year 2018. Color and size of the dots mean for the reported prevalence. c: The sites used for statistical evaluations between the communities of vertebrates and infection rates of Borrelia spp. were calculated. The color of each point (which is actually an hexagon whose diameter is 0.25º) corresponds to the correlative numbering of the clusters obtained from the bioregionalization of vertebrates.
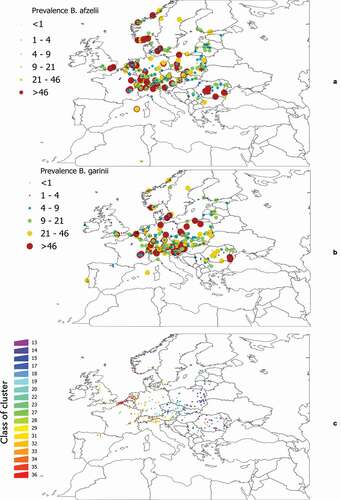
Figure 2. Clustering and the regions resulting from bioregionalization of the expected distribution of vertebrates in the target region, the expected distribution of Ixodes ricinus and its niche overlap. The map was obtained using an unsupervised classification using k-means on the raster maps of the predicted distribution of 165 species of vertebrates and I. ricinus and calculating the predicted niche occupancy of every pair of combinations vertebrate – tick. The unsupervised classification returned 36 categories, of which the 1 and 2 are in northern Scandinavia, western Russia, and eastern Turkey, where I. ricinus is absent. We kept the remaining 34 categories. Colors of the figure are random.
Figure 3. A heatmap representing the abundance of vertebrates, weighted by the contact rates with Ixodes ricinus in the western Palearctic at each cluster of the territory. The values in the heatmap show two dendrograms, one for the vertebrates that tend to appear together (left of the figure) and the other for sites that tend to support similar fauna of vertebrates (top of the figure). Specific names for every vertebrate are included, even if the phylogenetic tree of vertebrates has been made using only generic denominations.
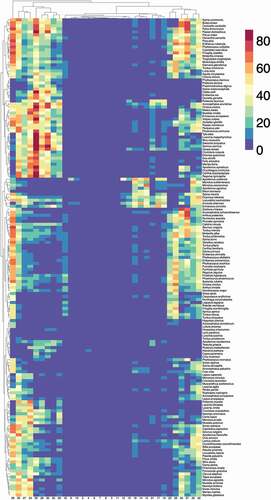
Figure 4. Species richness of vertebrates in the target territory. The value must be interpreted as the number of vertebrates reported as hosts of I. ricinus that are expected to be present in the territory and available for the tick because they share portions of the environmental niche.
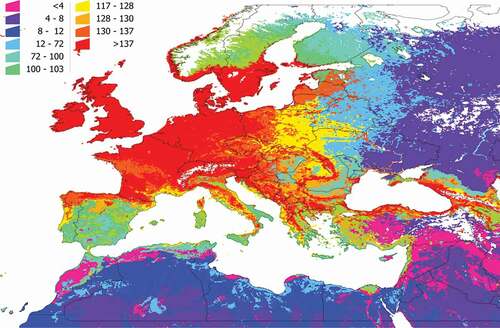
Figure 5. The phylogenetic diversity of the vertebrates in the target territory. The value must be interpreted as the phylogenetic diversity of the vertebrates reported as hosts of I. ricinus that are expected to be present in the territory, measured by the method of Faith. Supplementary Research Data contains the details of the spatial distribution of each cluster, and the use of portions of the phylogenetic tree of the vertebrates by the tick in each cluster.
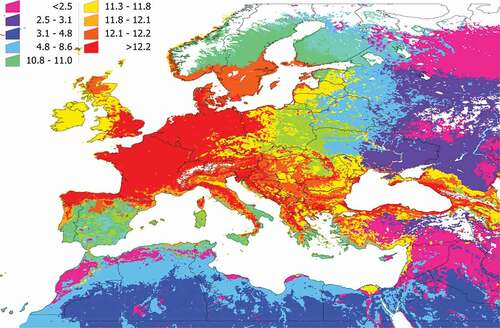
Figure 6. The modelled suitability of each species of vertebrate included in this study, weighted by the contact rates with the tick I. ricinus and the preferences of the tick for each host (histograms). Only data for areas included in the categories 20, 32 and 35 are shown, since they represent the most contrasting sites regarding prevalence of Borrelia spp. in the target territory. These ar ethe sites that were subjected to modeling. A small map at right shows the spatial extension of these territories. All these data were obtained from Supplemental material 3.
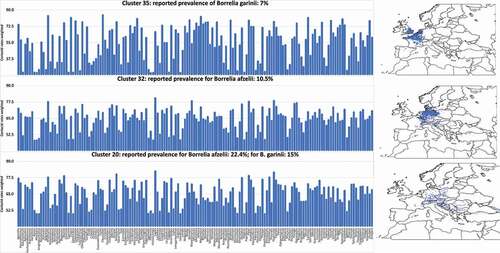
Table 1. Outcome of the modeling algorithms between the vertebrates’ community and the reported prevalence of Borrelia afzelii and Borrelia garinii in questing nymphs of Ixodes ricinus ticks, including clusters 12 to 36, for which there are available data. Cluster (left column) is a consecutive numbering of the unsupervised classification carried out on the target territory as shown in . The column ‘prevalence’ indicates the averaged reported prevalence of either B. afzelii or B. garinii together with the number of reported surveys in that cluster in parentheses. Each other column indicates the percent of correct classification of the prevalence of Borrelia in questing ticks by the regression and classification algorithms, separately for the two pathogens tested.
Figure 7. The indicator community of vertebrates projected on the reduced space in two areas of the target territory reporting different rates of infection by B. afzelii in questing nymphs of I. ricinus.
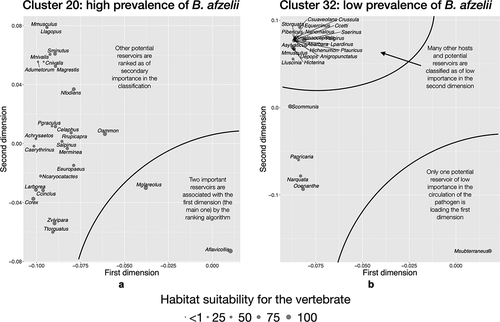
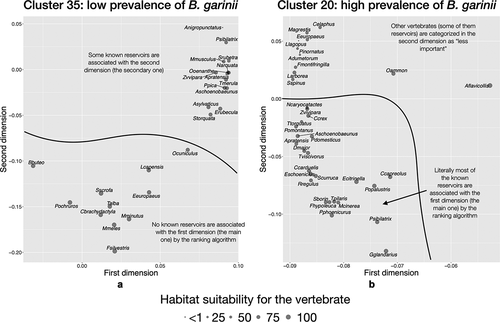
Figure 8. The indicator community of vertebrates projected on the reduced space in two areas of the target territory reporting different rates of infection by B. garinii in questing nymphs of I. ricinus.