Figures & data
Table 1. Cytokine measurement summary for animals treated with extracellular vesicles (n = 10).
Table 2. Summary of mouse body weights (n = 10).
Table 3. Haematology summary for test animals on day 23 (n = 10).
Table 4. Blood chemistry summary for test animals (n = 10).
Table 5. Threshold cycle (Ct) values of mature miR-199a-3p in liver tissue samples.
Figure 1. Measurements of different cell populations in spleen cells by flow cytometry using appropriate surface markers conjugated with different fluorochromes. Fluorescence signal of T-cell surface marker CD3e conjugated with PE-Vio770 (P1 = T cells) and B-cell surface marker CD19 conjugated with APC-Vio770 (P2 = B cells) on the cells from mice receiving (a) vehicle control or (b) lipopolysaccharide (LPS). The percentage of each cell population in mice (c) 24 h after LPS treatment (three doses, n = 4) or (d) 3 weeks after treatment with extracellular vesicles (10 doses, n = 10). Bars and error bars denote the mean and standard deviation, respectively, of experimental groups. PBS, phosphate-buffered saline; WT, wild-type HEK293T cells. *p < 0.05.
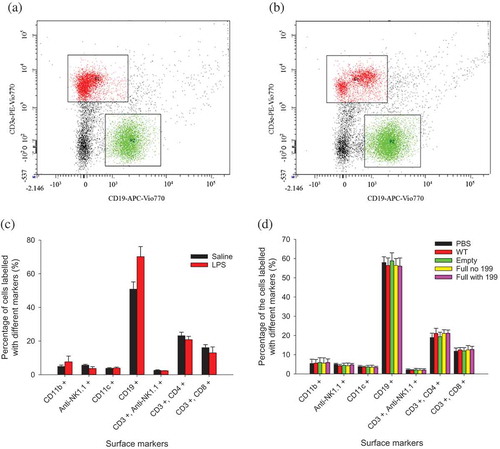
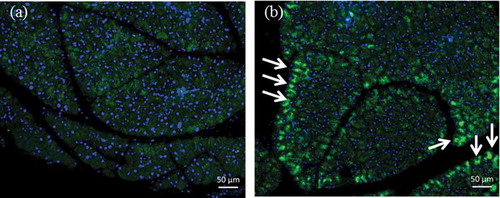
Figure 2. HIS protein detection in pancreas by immunohistochemistry: (a) phosphate-buffered saline control; (b) full construct with miR-199a-3p (Full with 199) extracellular vesicle (EV) treatment group. HIS protein was expressed and detected in the Full with 199 EVs (arrows).