Figures & data
Figure 1. ASC survival ex vivo with irradiated, non-irradiated secretomes and secretomes treated with Cleanascite. (a) Representative flow cytometry analysis of blood ASC (CD19+CD27hiCD38hi) from PMBC isolated 7 days after vaccination from a healthy adult. (b) Blood ASC from a healthy adult after Tdap-vaccination cultured in vehicle (R10) and secretomes from non-irradiated and irradiated BM-MSC. Each culture well was seeded with ~1,913 (for vehicle) or ~1,275 (for secretomes) ASC. Cells were harvested at days 0, 1, 3 and 6 post-culture and the frequency of IgG-secreting ASC were measured by Elispot assays; the spot numbers were normalized to maximal ASC (100%) as determined by each individual experiment. Shown on the right are representative Elispot images (at day 3). (c) Blood ASC from a healthy adult at the peak of ASC frequencies (7 days after rabies immunization) were cultured in vehicle (R10), secretome from irradiated BM-MSC, and secretome from irradiated BM-MSC that had been pretreated with Cleanascite. Each culture well was seeded with ~1,500 ASC. Cells were harvested at days 0, 1, 3, and 7 post-culture and the frequency of IgG-secreting ASC were measured by Elispot assays; the spot numbers were normalized to maximal Elispot frequencies (100%) as determined by each individual experiment. Representative Elispot images (at day 3) are shown. Experiments in Figure 1(b,c) are representative of > 3 experiments. Nonirr, non-irradiated; Irr, irradiated; CLN, Cleanascite.
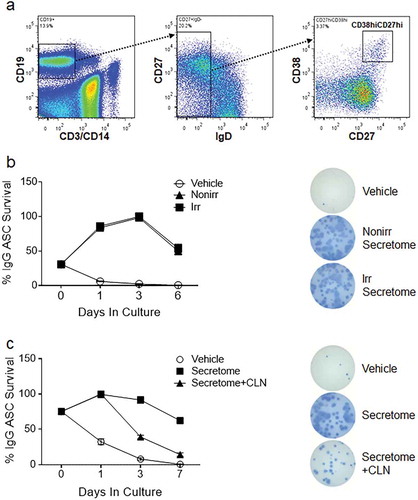
Figure 2. Quantification and EM of EVs isolated from irradiated and non-irradiated secretomes. (a) Quantification of particles from EV fractions and EV-reduced fractions of non-irradiated and irradiated MSC secretomes by nanosight. (b) Distribution of the concentration of various size particles from non-irradiated and irradiated EV fractions and EV-reduced fractions, whole secretome, and vehicle controls. (c) Representative whole-field EM images for EV fractions isolated from irradiated or non-irradiated BM-MSC secretomes. Imaging was performed using uranyl-oxalate negative staining and observed using a JEOL Transmission Electron Microscope. Twelve grids were prepared and imaged and counted by observers who were blinded to the treatment status. Scale bar indicates 200 nm. EVs are 50–100 nm in size, and putative vesicles are indicated by white dashed lines. (d) Ten to twelve high-power fields were enumerated for 50–100 nm vesicles by blinded observers (p = 0.015; Mann–Whitney test). Nonirr, non-irradiated; Irr, irradiated.
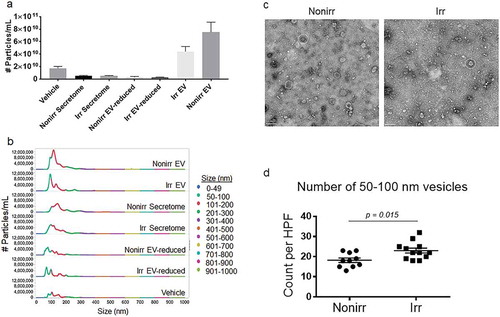
Figure 3. Immuno-gold EM of EV markers. Immuno-gold-labelling EM confirms 50–100 nm vesicles, referred to as EVs. Immuno-gold labelling with (a) CD63 and (b) CD81 on ultrastructure of EVs appeared comparable for those derived from non-irradiated and irradiated BM-MSC. Scale bar indicates 50 nm. These micrographs are representative of over two dozen such images using EV fractions derived from three donors. Nonirr, non-irradiated; Irr, irradiated.
Figure 4. Both irradiated and non-irradiated BM-MSC-derived EVs support ASC survival. (a) Blood ASC were isolated from a healthy adult 7 days after Tdap vaccination and cultured in vehicle (R10) or EV fractions from irradiated or non-irradiated BM-MSC secretomes. Each culture well was seeded with ~1,913 ASC. Cells were harvested at days 0, 1, 3 and 6 post-culture and IgG Elispots were performed. IgG-secreting ASC spot frequencies were normalized to maximal ASC Elispots (100%) (p < 0.0001, two-way ANOVA). Shown on the right are representative photomicrographs (at day 3). The figure shows the representative data from three independent experiments. (b) IgG spot frequencies from ASC cultured in vehicle (R10) or EV-reduced fractions from irradiated and non-irradiated BM-MSC secretomes. Each culture well was seeded with ~1,913 (for vehicle) or ~1,275 (for EV-reduced fractions) ASC. Cells were harvested at days 0, 1, 3 and 6 post-culture and IgG Elispots were performed. IgG-secreting ASC spot frequencies were normalized to maximal ASC Elispots (100%) (p < 0.0001, two-way ANOVA). Shown on the right are representative photomicrographs (at day 3). (c) Blood ASC from two healthy adults were cultured in PBS and EV fractions from irradiated or non-irradiated BM-MSC secretomes, with and without pretreatment with Cleanascite. Each culture well was seeded with ~829 or ~927 ASC. Cells were harvested at days 0, 1 or 3 post-culture and the frequency of IgG-secreting ASC were measured by Elispot assays; the spot numbers were normalized to maximal Elispot frequencies (100%). Representative Elispot images (at day 3) are shown. Nonirr, non-irradiated; Irr, irradiated; CLN, Cleanascite.
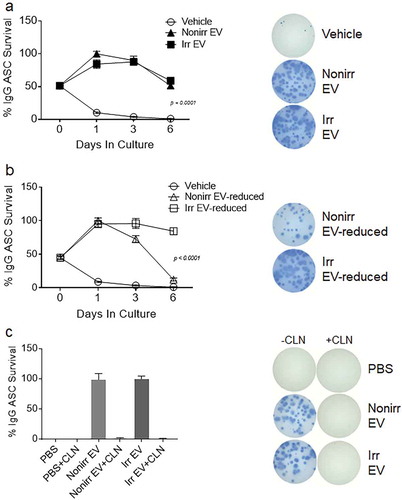
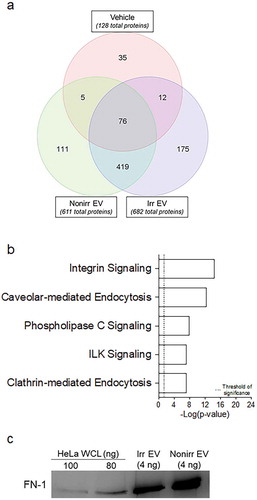
Figure 5. Proteomics of irradiated vs. non-irradiated EVs. (a) The 419 common proteins found in both EV fraction types were used as input for IPA. (b) Curated list of five of the most significantly represented pathway lists generated by IPA. Within the IPA platform, a pathway was considered statistically significant according to the proportion of pathway members present. A statistically significant p-value of 0.05 is equivalent to a – log(p = 1.35), which is indicated on the plot as a vertical dashed line, at the x-value of 1.35. (c) Western blot analysis of fibronectin-1 (FN-1) from both irradiated and non-irradiated EV fractions. HeLa whole-cell lysates (WCL) were used as positive controls. Nonirr, non-irradiated; Irr, irradiated.