Figures & data
Figure 1. CD63-eGFP but not eGFP expressing HEK293T cells release high quantities of eGFP-labelled particles into their extracellular environment. After processing of supernatants of HEK293T cells either transfected with eGFP-encoding plasmids (left side) or CD63-eGFP-encoding plasmids (right side) with ultracentrifugation, 1 µL of each resolved pellet was transferred onto a microscopic slide and allowed to dry (results in crystal formation). At the original border of the HEK293T CD63-eGFP drop, high amounts of GFP+-particles were concentrated. Upper row: fluorescent image, lower row: overlay fluorescent and bright field images; scale bar: 50 µm for all images.
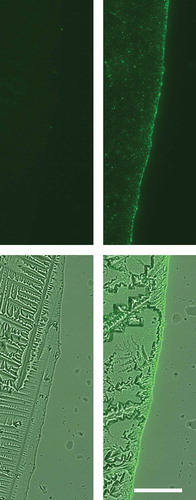
Figure 2. Comparison of different PEG precipitation conditions. Conditioned media were diluted with PEG 6000 (P6), PEG 8000 (P8) or PEG 20000 (P20) to final concentrations of 6, 8, 10, 12 or 15% (v/v), respectively. Following incubation overnight at 4°C, EVs were precipitated by centrifugation at 1,500 × g for 30 min (4°C). EVs precipitated by direct ultracentrifugation (UC), served as control. Obtained pellets were re-suspended in PBS and re-precipitated at 110,000 × g for 2 h (4°C). After dissolving in 250 µL PBS, the particle concentration (n = 5; SD); (a) and their average size distribution (n = 5; SD); (b) were assessed by NTA (LM10). The purity of the obtained samples was determined as particle numbers – measured by NTA – per µg protein content – measured by the BCA assay (n = 5; SEM; (c). The presence of the exosomal marker protein Tsg101 was analysed by western blot; 20 µL of each fraction were loaded per lane (d). Conditioned media were diluted with PEG 8000 to a final concentration of 10% PEG 8000 (v/v). Following incubation for 1, 2, 4 and 8 h or overnight (16 h) at 4°C, respectively, EVs were precipitated by centrifugation at 1,500 × g for 30 min (4°C). Obtained pellets were re-suspended in PBS and re-precipitated at 110,000 × g for 2 h (4°C). After dissolving in 250 µL PBS, the particle concentration was measured by NTA (n = 3; SD) and the presence of the exosomal marker protein Tsg101 was analysed by western blot; 5 µg protein of each Fraction was loaded per lane (e).
Figure 3. Comparison of different methods to enrich nano-sized EVs. EVs from 10 mL HEK293T-CD63-eGFP (single-cell clones C5, F5, E7 and B2) cell conditioned media were either prepared by direct ultracentrifugation (UC), differential centrifugation (DC), PEG 6000 or PEG 8000 precipitation, density gradient centrifugation (DG), or size-exclusion chromatography (SE). The particle concentration (n = 3; SD, (a) and their average size distribution (n = 3; SD, (b) were assessed by NTA (NanoSight LM10). The purity of the obtained samples was determined as particle numbers – measured by NTA – per µg protein content – measured by the BCA assay (n = 3; SD, (c). The presence of the exosomal marker protein Tsg101 was analysed by western blot; 10 µg of each fraction were loaded per lane (d). Electron micrographs of samples from UC, DC, DG and PEG enriched EVs were acquired; scale bars 200 nm (e). To test for potential impacts on the physiology of the obtained EVs, uptake experiments were performed: 1 × 10⁸ particles as estimated by NTA were supplemented to the media of N-KM cells. After 14–16 h, pictures were taken (f) before the amount of the eGFP labelling was quantified as the mean fluorescence intensity (MFI) by flow cytometry (n = 3; SD, t-test,*p > 0.05, (g)). Scale bars 10 µm.
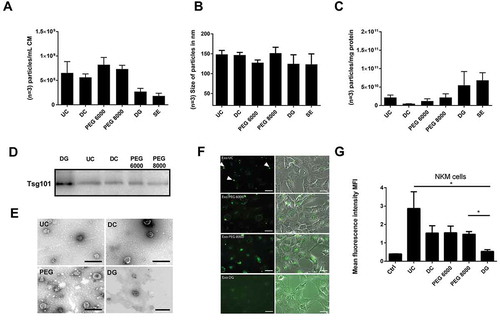
Figure 4. PEG-precipitation versus differential centrifugation (DC). EVs from 10 mL HEK293T-CD63-eGFP cell conditioned media were either prepared by PEG precipitation or differential centrifugation. The particle concentration per fraction (n = 3; SD, (a) and their average size distribution (n = 3; SD, (b)) were assessed by NTA (ZetaView). The purity of the obtained samples was determined as particle numbers – measured by NTA – per mg protein content – measured by the BCA assay (c). The presence of the EV marker proteins HSP70, CD63, CD81 and CD9, and within the individual PEG samples was analysed by western blot; 5 µg proteins were loaded per lane (d). The content of CD81, CD9 and BSA was compared in final EV samples harvested from of HEK293T-CD63-eGFP clones C5, F5, E7, either harvested by PEG 6000 precipitation (PUP) or differential centrifugation (DCP). Proteins obtained from supernatants of the final PEG pellets (PUS) or the ultracentrifugation pellet (DCS) obtained in the differential centrifugation method served as controls. 2.5 µg proteins were loaded per lane (e). Of note, following analyses of CD81 blots were stripped and re-analysed for the presence of BSA.
Figure 5. Up-scaling of PEG-precipitation. EVs from 360 mL HEK293T-CD63-eGFP cell conditioned media were prepared by PEG precipitation. The particle concentration per fraction (n = 3; SD, (a) and their average size distribution (n = 3; SD, (b) were assessed by NTA (ZetaView). The purity of the obtained samples was determined as particle numbers – measured by NTA – per mg protein content – measured by the BCA assay (c). The presence of the EV marker proteins HSP70, Tsg101, CD63, CD81 and CD9 within the individual PEG samples was analysed by western blot. Additionally, the content of BSA, Syntenin and Prohibitin within the final samples was compared; 5 µg proteins were loaded per lane (d). To test for potential impacts on the physiology of the obtained EVs, uptake experiments were performed: 30–50 µg of the obtained samples were supplemented to the cell culture media of N-KM cells. After 14–16 h pictures were taken, then, the amount of the eGFP labelling was quantified as the mean fluorescence intensity (MFI) by flow cytometry (e). Scale bars 20 µm.
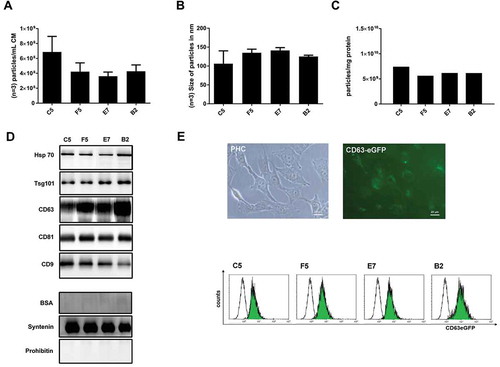
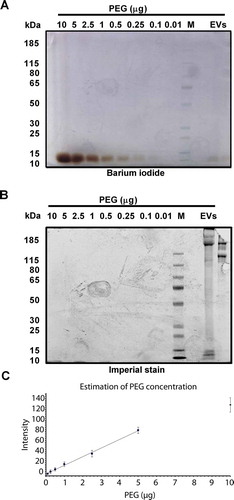
Figure 6. Detection of residual PEG. Two gels were loaded with PEG 6000 in decreasing amounts (10, 5, 2.5, 1, 0.5, 0.25, 0.1, 0.01 µg), protein marker, and 6 µg of the final EV samples of HEK293T-CD63-eGF clone B2 and C5 cells. Gels were run under identical conditions. PEG was detectable after barium iodide staining (a); proteins following protein specific imperial stain (b). Signals in (a) were recorded with Image Studio™ Software (LI-COR) and plotted against the PEG concentration of the calibration values (c). The graphic evolution indicates a linear equation of y = 15.692× + 3.4984 which was used to calculate the revealed PEG concentration of 0.02% in the final EV samples.