Figures & data
Table 1. Patient information.
Table 2. Comparison of circulating vesicles and EV-DNMT mRNAs expression.
Table 3. Differences for all days combined for total (combined) EV-DNMT mRNAs within patient severity.
Table 4. Differences over all days analysed for individual EV-DNMT mRNAs within patient severity.
Table 5. Differences between each day analysed for individual EV-DNMT mRNAs within patient severity.
Figure 1. Septic shock patients have increased total EV-DNMT mRNAs compared to control or septic patients. (a) Total EV-DNMT mRNAs collected from EVs over all days. Whole blood was collected from critically ill, non-septic patients or patients with sepsis or septic shock on the first day in the ICU (Day 1). Fresh plasma EVs were isolated, 1 µg total RNA of each sample was purified, cDNA synthesized and subjected to qPCR analysis using primers specific for human DNMT1, DNMT3A, DNMT3B, or CAP1, and RPL4 (internal controls) mRNAs. Total combined mRNA expression for EV-DNMT1, EV-DNMT3A, and EV-DNMT3B over 1, 3, or 5 days was analysed using the comparative threshold method and normalized against the internal control transcripts. Data are represented as geometric means and geometric standard deviation from N = 29 critically ill, non-septic (grey); N = 28 sepsis (blue); and N = 17 septic shock (combined those who lived to day 5 and those who died before day 5) (red). Overall, F-ratio = 53.83 and P < 0.00001 (two-way ANOVA) and *P < 0.01 vs control and **P < 0.01 vs sepsis (Tukey’s post hoc test). (b) Total EV-DNMT mRNAs collected from EVs at Day 1. Data (mean±SEM) from N = 12 septic shock patients who lived to day 5 (red) and N = 9 septic shock patients who died before day 5 (orange). *P = 0.0151 (Two-tailed T-test). (c) Individual EV-DNMT1, EV-DNMT3A, and EV-DNMT3B mRNA expression for each severity group (critically ill, non-septic; sepsis; septic shock) over each day (1, 3, and 5). EV-DNMT1 mRNA at day 1 (left column, top row). Data (mean±SEM) from N = 10 critically ill, non-septic; N = 10 sepsis; and N = 7 septic shock patients. ANOVA: F-ratio = 5.80 and P = 0.0088; and *P < 0.05 vs control and **P < 0.05 vs sepsis (Tukey’s post hoc test). EV-DNMT1 mRNA at day 3 (left column, middle row). N = 10 critically ill, non-septic; N = 9 sepsis; and N = 6 septic shock patients. ANOVA: F-ratio = 22.00 and two-tailed P < 0.00001; and *P < 0.01 vs control and **P < 0.01 vs sepsis (Tukey’s post hoc test). DNMT1 mRNA at day 5 (left column, bottom row). N = 9 critically ill, non-septic; N = 9 sepsis; and N = 4 septic shock patients. ANOVA: F-ratio = 86.56 and P < 0.00001; and *P < 0.01 vs control and **P < 0.01 vs sepsis (Tukey’s post hoc test). EV-DNMT3A mRNA at day 1 (middle column, top row). N = 10 critically ill, non-septic; N = 10 sepsis; and N = 7 septic shock patients. ANOVA: F-ratio = 9.88 and P = 0.0007; and *P < 0.01 vs control and **P < 0.01 vs sepsis (Tukey’s post hoc test). EV-DNMT3A mRNA at day 3 (middle column, middle row). N = 10 critically ill, non-septic; N = 9 sepsis; and N = 6 septic shock patients. ANOVA: F-ratio = 14.41 and two-tailed P < 0.0001; *P < 0.01 vs control and **P < 0.01 vs sepsis (Tukey’s post hoc test). EV-DNMT3A mRNA at day 5 (middle column, bottom row). N = 9 critically ill, non-septic; N = 9 sepsis; and N = 4 septic shock patients. ANOVA: F-ratio = 5.01 and P < 0.0179; and *P < 0.05 vs control (Tukey’s post hoc test). EV-DNMT3B mRNA at day 1 (right column, top row). N = 10 critically ill, non-septic; N = 10 sepsis; and N = 7 septic shock patients. ANOVA: F-ratio = 7.16 and P = 0.0036; *P < 0.01 vs control and **P < 0.01 vs sepsis (Tukey’s post hoc test). EV-DNMT3B mRNA at day 3 (right column, middle row). N = 10 critically ill, non-septic; N = 9 sepsis; and N = 6 septic shock patients. ANOVA: F-ratio = 19.24 and two-tailed P < 0.00002; *P < 0.01 vs control and **P < 0.01 vs sepsis (Tukey’s post hoc test). EV-DNMT3B mRNA at day 5 (right column, bottom row). N = 9 critically ill, non-septic; N = 9 sepsis; and N = 4 septic shock patients. ANOVA: F-ratio = 25.16 and P < 0.00001; *P < 0.01 vs control and **P < 0.01 vs sepsis (Tukey’s post hoc test).
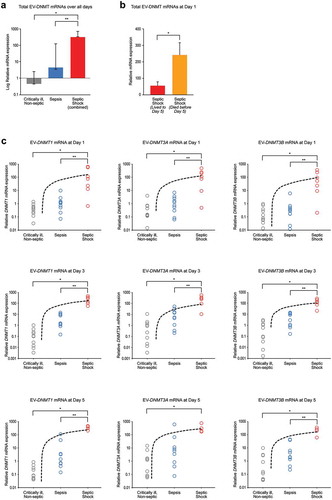
Table 6. Correlation of EV-DNMT3A + EV-DNMT3B mRNAs to patient severity over all days combined.
Figure 2. Septic shock EV-DNMT levels cluster distinct of control and sepsis patients. (a) Correlation of EV-DNMT1 mRNA vs EV-DNMT3A + EV-DNMT3B mRNAs for each severity group over all days. EVs were isolated and RNA was isolated as described earlier. Data were reported as log relative expression of EV-DNMT1 mRNA as a function of log relative EV-DNMT3A + EV-DNMT3B mRNAs for each severity group (critically ill, non-septic (grey dots); sepsis (blue dots); septic shock patients who lived to 5 days (red dots); and septic shock patients who died before day 5 (orange dots). N = 29 for critically ill, non-septic; N = 28 for sepsis; N = 17 for septic shock who lived to day 5; N = 5 for septic shock who died by day 5. Spearman’s rho, ρ = 0.86464, and two-tailed P < 0.00001. Hotelling’s T2 = 103.5407, df = [Citation2, 71], P < 0.0001 for critically ill, non-septic and sepsis vs septic shock (combined) for clustering. (b) Correlation of EV-DNMT1 mRNA vs EV-DNMT3A + EV-DNMT3B mRNAs for each severity at day 1 (top). N = 10 for critically ill, non-septic; N = 10 for sepsis; N = 4 for septic shock who lived to day 5; N = 3 for septic shock who died by day 5. Spearman’s rho, ρ = 0.79786, and two-tailed P < 0.00001. (Hotelling’s T2 = 29.8335, df = (2, 7.6165), P < 0.0001) for critically ill, non-septic and sepsis vs septic shock (combined) for clustering. Correlation of EV-DNMT1 mRNA vs EV-DNMT3A + EV-DNMT3B mRNAs for each severity at day 3 (middle). N = 10 for critically ill, non-septic; N = 9 for sepsis; N = 4 for septic shock who lived to day 5; N = 2 for septic shock who died by day 5. Spearman’s rho, ρ = 0.93615, and two-tailed P < 0.00001. (Hotelling’s T2 = 84.7831, df = (2, 20.9335), P < 0.0001) for critically ill, non-septic and sepsis vs septic shock (combined) for clustering. Correlation of EV-DNMT1 mRNA vs EV-DNMT3A + EV-DNMT3B mRNAs for each severity at day 5 (bottom). N = 9 for critically ill, non-septic; N = 9 for sepsis; N = 4 for septic shock who lived to day 5. Spearman’s rho, ρ = 0.81028, and two-tailed P < 0.00001. (Hotelling’s T2 = 131.6986, df = (2, 19.6058), P < 0.0001)) for critically ill, non-septic and sepsis vs septic shock (combined) for clustering. (c) Correlation of EV-DNMT1 mRNA vs EV-DNMT3A + EV-DNMT3B mRNAs for each day 1 (white dot), day 3 (grey dot), and day 5 (black dot) for critically ill, non-septic patients (top). N = 10 for day 1; N = 10 for day 3; N = 9 for day 5. Spearman’s rho, ρ = 0.75153, and two-tailed P < 0.00001. Correlation of EV-DNMT1 mRNA vs EV-DNMT3A + EV-DNMT3B mRNAs for each day 1 (white dot), day 3 (grey dot), and day 5 (black dot) for sepsis patients (middle). N = 10 for day 1; N = 9 for day 3; N = 9 for day 5. Spearman’s rho, ρ = 0.71795, and two-tailed P = 0.00002. Correlation of EV-DNMT1 mRNA vs EV-DNMT3A + EV-DNMT3B mRNAs for each day 1 (white dot), day 3 (grey dot), and day 5 (black dot) for septic shock patients who lived to day 5 (bottom). N = 7 for day 1; N = 6 for day 3; N = 4 for day 5. Spearman’s rho, ρ = 0.55147, and two-tailed P = 0.02175.
![Figure 2. Septic shock EV-DNMT levels cluster distinct of control and sepsis patients. (a) Correlation of EV-DNMT1 mRNA vs EV-DNMT3A + EV-DNMT3B mRNAs for each severity group over all days. EVs were isolated and RNA was isolated as described earlier. Data were reported as log relative expression of EV-DNMT1 mRNA as a function of log relative EV-DNMT3A + EV-DNMT3B mRNAs for each severity group (critically ill, non-septic (grey dots); sepsis (blue dots); septic shock patients who lived to 5 days (red dots); and septic shock patients who died before day 5 (orange dots). N = 29 for critically ill, non-septic; N = 28 for sepsis; N = 17 for septic shock who lived to day 5; N = 5 for septic shock who died by day 5. Spearman’s rho, ρ = 0.86464, and two-tailed P < 0.00001. Hotelling’s T2 = 103.5407, df = [Citation2, 71], P < 0.0001 for critically ill, non-septic and sepsis vs septic shock (combined) for clustering. (b) Correlation of EV-DNMT1 mRNA vs EV-DNMT3A + EV-DNMT3B mRNAs for each severity at day 1 (top). N = 10 for critically ill, non-septic; N = 10 for sepsis; N = 4 for septic shock who lived to day 5; N = 3 for septic shock who died by day 5. Spearman’s rho, ρ = 0.79786, and two-tailed P < 0.00001. (Hotelling’s T2 = 29.8335, df = (2, 7.6165), P < 0.0001) for critically ill, non-septic and sepsis vs septic shock (combined) for clustering. Correlation of EV-DNMT1 mRNA vs EV-DNMT3A + EV-DNMT3B mRNAs for each severity at day 3 (middle). N = 10 for critically ill, non-septic; N = 9 for sepsis; N = 4 for septic shock who lived to day 5; N = 2 for septic shock who died by day 5. Spearman’s rho, ρ = 0.93615, and two-tailed P < 0.00001. (Hotelling’s T2 = 84.7831, df = (2, 20.9335), P < 0.0001) for critically ill, non-septic and sepsis vs septic shock (combined) for clustering. Correlation of EV-DNMT1 mRNA vs EV-DNMT3A + EV-DNMT3B mRNAs for each severity at day 5 (bottom). N = 9 for critically ill, non-septic; N = 9 for sepsis; N = 4 for septic shock who lived to day 5. Spearman’s rho, ρ = 0.81028, and two-tailed P < 0.00001. (Hotelling’s T2 = 131.6986, df = (2, 19.6058), P < 0.0001)) for critically ill, non-septic and sepsis vs septic shock (combined) for clustering. (c) Correlation of EV-DNMT1 mRNA vs EV-DNMT3A + EV-DNMT3B mRNAs for each day 1 (white dot), day 3 (grey dot), and day 5 (black dot) for critically ill, non-septic patients (top). N = 10 for day 1; N = 10 for day 3; N = 9 for day 5. Spearman’s rho, ρ = 0.75153, and two-tailed P < 0.00001. Correlation of EV-DNMT1 mRNA vs EV-DNMT3A + EV-DNMT3B mRNAs for each day 1 (white dot), day 3 (grey dot), and day 5 (black dot) for sepsis patients (middle). N = 10 for day 1; N = 9 for day 3; N = 9 for day 5. Spearman’s rho, ρ = 0.71795, and two-tailed P = 0.00002. Correlation of EV-DNMT1 mRNA vs EV-DNMT3A + EV-DNMT3B mRNAs for each day 1 (white dot), day 3 (grey dot), and day 5 (black dot) for septic shock patients who lived to day 5 (bottom). N = 7 for day 1; N = 6 for day 3; N = 4 for day 5. Spearman’s rho, ρ = 0.55147, and two-tailed P = 0.02175.](/cms/asset/9a6262cb-bd6a-41f0-ad01-985d127f39e1/zjev_a_1669881_f0002_oc.jpg)
Figure 3. Septic shock patients have increased circulating plasma EVs. (a) Analysis for concentration and size distribution of plasma EVs. Plasma EVs from critically ill non-septic, sepsis and septic shock patients were isolated and collected as described in Methods. EVs were subjected to NanoSight (light scatter) analysis for determination of total EVs mL−1 plasma and their respective diameter sizes ranging from ~30 to 400 µm. A NanoSight spectrum was collected for each patient in the cohort. Those individual spectra were placed at the correct scale on the same axes. At each nm, the highest and lowest EV population was included by shading in that area in which was populated between the samples so that each spectrum represents the actual variation of all donors in that cohort. Dotted line and box indicate magnification of the healthy donor EV spectrum (purple) by 1,000-fold compared to the EV spectrum from critically ill, non-septic patients (grey) (first column). Spectra represent N = 4 for healthy donors and N = 3 for critically ill, non-septic at day 1. Comparison of critically ill, non-septic (grey) and sepsis (blue) EV spectrums at each day 1, 3, and 5 (second column). Spectra represent N = 3 at each day for critically ill, non-septic and N = 4 at each day for sepsis. Comparison of sepsis (blue) and septic shock (patients who lived and died by day 5, combined) (red) EV spectrums at each day 1, 3, and 5 (third column). Spectra represent N = 4 for sepsis at each day and N = 7 for septic shock (combined lived to day 5 and died by day 5) at days 1 and 3 and N = 4 for day 5. Comparison of septic shock patients who lived to day 5 (red) and septic shock patients who died before day 5 (orange) EV spectrums at each day 1 and 3 (right column). Spectra represent N = 4 for septic shock who lived to day 5 and N = 3 for septic shock who died by day 5. (b) EVs mL−1 plasma over all days combined by severity. Septic shock patients (both those who lived to day 5 and those who died before day 5, combined (red) had more EVs mL−1 than critically ill, non-septic (grey) or sepsis (blue) patients. ANOVA: F-ratio = 7.12 and two-tailed P < 0.0025; and *P < 0.05 and **P < 0.01 (Tukey’s post hoc). N = 9 for critically ill, non-septic; N = 12 for sepsis, N = 18 for septic shock (N = 4 at each day 1, 3, and 5 for patients who lived to day 5 and N = 3 at each day 1 and 3 for patients who died before day 5). (c) Extracellular vesicles mL−1 plasma at each day (1, 3, and 5). The healthy donor cohort (purple) had significantly less EVs/mL than all other samples (*P < 0.001). At day 1, the septic shock patients who died before day 5 (orange) had significantly more EVs/mL than the critically ill, non-septic (grey), sepsis (blue), and septic shock patients who lived to day 5 (red). ANOVA: F-ratio = 8.02 and two-tailed P < 0.0051; and **P < 0.05 vs critically ill non-septic (CINS) and septic shock patients who lived to day 5, and #P < 0.01 vs sepsis (Tukey’s post hoc). At Day 3, the septic shock patients who died before day 5 (orange) had significantly more EVs/mL than the critically ill, non-septic (grey), sepsis (blue), and septic shock patients who lived to day 5 (red). ANOVA: F-ratio = 9.06 and two-tailed P < 0.0034; and P < 0.01 vs all other samples (Tukey’s post hoc). At Day 5, the septic shock patients who lived to day 5 (red) had significantly more EVs/mL than the critically ill, non-septic (grey) and sepsis (blue). ANOVA: F-ratio = 8.01 and two-tailed P < 0.0123; and $P < 0.05 vs all other samples (Tukey’s post hoc). N = 4 for Healthy donors, N = 9 for critically ill, non-septic; N = 12 for sepsis, N = 18 for septic shock (N = 4 at each day 1, 3, and 5 for patients who lived to day 5 and N = 3 at each day 1 and 3 for patients who died before day 5).
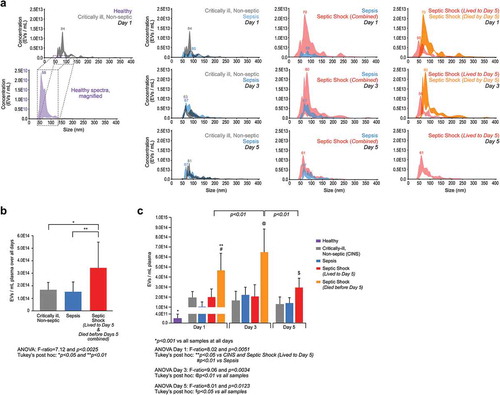
Table 7. Differences in extracellular vesicle release over days.
Figure 4. DNMT mRNAs per individual EVs correlates with patient severity. (a) All EV-DNMT mRNAs per EV at Day 1. Those patient samples who had their DNMT mRNAs analysed by qPCR and subjected to NanoSight for plasma EVs concentration were used to determine DNMT mRNAs per EV. There is a significant correlation for all DNMT mRNAs per EV at Day 1 vs patient severity. (Spearman’s rho: ρ = 0.6844 and two-tailed P = 0.0001. N = 9 for critically ill (grey), non-septic; N = 12 for sepsis (blue); N = 21 for septic shock (combined lived to day 5 and died before day 5) (red)). (b) (Left) EV-DNMT1 mRNA per EV at Day 1. There is a significant correlation for EV-DNMT1 mRNAs per EV at Day 1 vs patient severity. (Spearman’s rho: ρ = 0.6523 and two-tailed P = 0.0115. N = 3 for critically ill (grey), non-septic; N = 4 for sepsis (blue); N = 7 for septic shock (combined lived to day 5 and died before day 5) (red)). (Middle) EV-DNMT3A mRNA per EV at Day 1. There is a significant correlation for EV-DNMT3A mRNAs per EV at Day 1 vs patient severity. (Spearman’s rho: ρ = 0.7216 and two-tailed P = 0.0036. N = 3 for critically ill (grey), non-septic; N = 4 for sepsis (blue); N = 7 for septic shock (combined lived to day 5 and died before day 5) (red)). (Right) EV-DNMT3B mRNA per EV at Day 1. There is a significant correlation for EV-DNMT3B mRNAs per EV at Day 1 vs patient severity. (Spearman’s rho: ρ = 0.6953 and two-tailed P = 0.0058. N = 3 for critically ill (grey), non-septic; N = 4 for sepsis (blue); N = 7 for septic shock (combined lived to day 5 and died before day 5) (red)). (c) EV-DNMT3A + EV-DNMT3B mRNA per EV at Day 1. There is a significant correlation for EV-DNMT3A + EV-DNMT3B mRNA (role in de novo methylation) per EV at Day 1 vs patient severity. (Spearman’s rho: ρ = 0.7383 and two-tailed P = 0.0026. N = 3 for critically ill (grey), non-septic; N = 4 for sepsis (blue); N = 7 for septic shock (combined lived to day 5 and died before day 5) (red)).
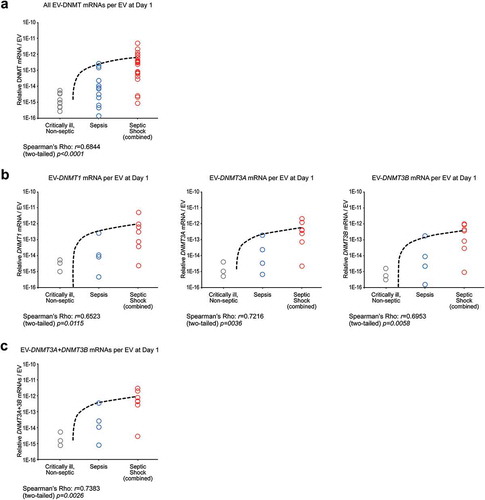
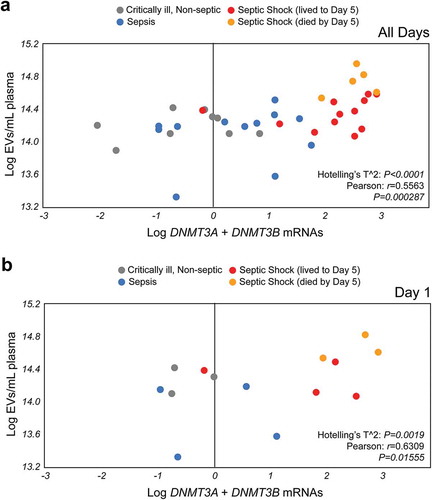
Figure 5. Plasma EVs numbers and de novo EV-DNMT mRNAs expression have prognostic value for septic shock. (a) Septic shock EVs cluster separately from critically ill, non-septic and sepsis patient EVs based on de novo DNA methyltransferase expression over all days analysed. EVs mL−1 plasma as a function of the combination EV-DNMT3A + EV-DNMT3B mRNAs expression (EV-DNMT3A + EV-DNMT3B) (Pearson r = 0.5565, P = 0.000287 and Hotelling’s T2 = 62.5726, df = (2, 35.9031), P < 0.0001). N = 9 for critically ill, non-septic (grey); N = 12 for sepsis (blue); N = 17 for septic shock. The septic shock cohort (red = septic shock patients who lived to day 5, orange = septic shock patients who died before day 5). (b) Patient EV numbers mL−1 and EV-DNMT3A + EV-DNMT3B mRNA content predicts septic shock at Day 1. Plasma EVs mL−1 significantly correlate with de novo EV-DNMT mRNAs in circulation (Pearson r = 0.6795, P = 0.010627 and Hotelling’s T2 = 24.9017, df = (2, 11.6576), P = 0.0019 at day 1. N = 3 for critically ill, non-septic (grey); N = 4 for sepsis (blue); N = 7 for septic shock (combined). The septic shock cohort (red = septic shock patients who lived to day 5, orange = septic shock patients who died by day 5).