Figures & data
Figure 1. Major subbasins and time-of-travel synoptic survey mainstem, tributary, and effluent sampling sites in the South Saskatchewan River Basin in southern Alberta, Canada.
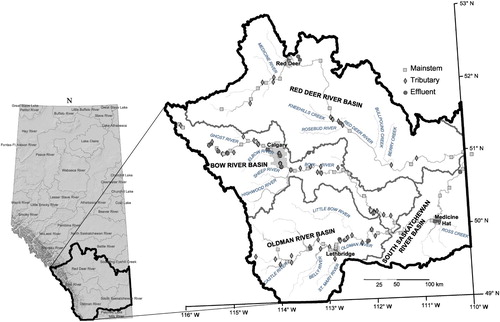
Table 1. Summary of pesticides detected in August synoptic survey (n = 155) and selected WWTP effluents in August 2014 (summer, n = 8) and February 2015 (winter, n = 8), including number of detections, detection frequency, range, and median of detected* concentrations. Pesticides detected in both August 2014 and February 2015 are in italics. Significant difference (p > 0.001) between seasons is indicated by results not sharing a common letter.
Figure 2. Pesticide detection frequency (%) according to the (a) river subbasin, (b) sample type, and (c) river subbasin and sample type. Groups not sharing a common letter indicate significant difference (p < 0.05) in a generalized linear mixed model. No significant differences in panel a or c. M = mainstem, T = tributary, E = effluent, South Sask = South Saskatchewan.
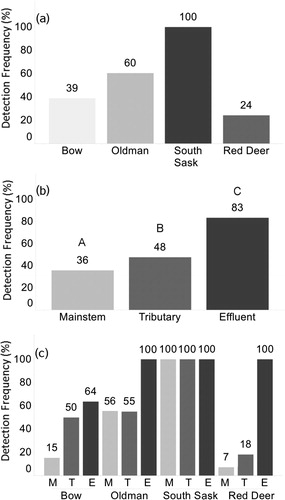
Table 2. Number of different pesticides detected per river subbasin and sampling site type, with average number of different pesticides detected per 1 L sample ± standard error in brackets. Within borders, groups not sharing a common letter indicate significant difference (p < 0.05) in a generalized linear mixed model. South Sask = South Saskatchewan.
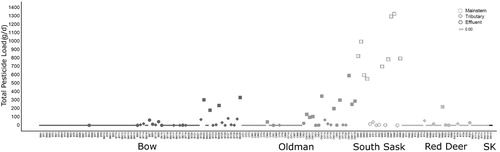
Figure 3. Total pesticide loads calculated at mainstem, tributary, and effluent water quality sample sites during the August 2014 synoptic survey (n = 155). South Sask = South Saskatchewan; SK = Province of Saskatchewan.