1,573
Views
1
CrossRef citations to date
0
Altmetric
Original Articles

In which direction to move? Facilitative and interference effects of gestures on problem solver's thinking

ORCID Icon, &
Pages 307-313 | Received 03 Oct 2017, Accepted 17 Jan 2018, Published online: 30 Jan 2018

Figures & data

Figure 1. Solution times in seconds from TOH1 (gray bars) to TOH2 (white bars) as a function of experimental group. The left graph shows the results for participants who did not explain between solving TOH1 and TOH2 and the right graph shows the results for participants that explained how they solved the task using gestures before solving TOH2. For both groups, results are shown separately for participants in the switch and no-switch condition.
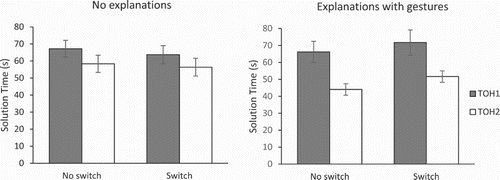
Figure 1. Solution times in seconds from TOH1 (gray bars) to TOH2 (white bars) as a function of experimental group. The left graph shows the results for participants who did not explain between solving TOH1 and TOH2 and the right graph shows the results for participants that explained how they solved the task using gestures before solving TOH2. For both groups, results are shown separately for participants in the switch and no-switch condition.

Figure 2. Change in solution time (TOH2 – TOH1) as a function of the percentage of left-to-right movement gestures, used to explain how TOH1 was solved. Results are shown separately for participants in the switch (right) and no-switch (left) condition.
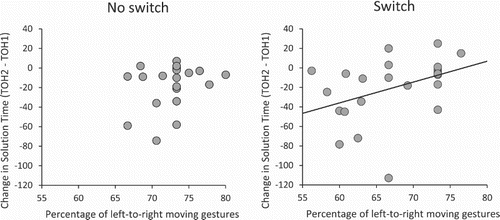
Figure 2. Change in solution time (TOH2 – TOH1) as a function of the percentage of left-to-right movement gestures, used to explain how TOH1 was solved. Results are shown separately for participants in the switch (right) and no-switch (left) condition.

Table 1. Analyses of variance for solution times on TOH task in seconds (df = 90).

Supplemental material

Datafile.sav

Download (5.6 KB)